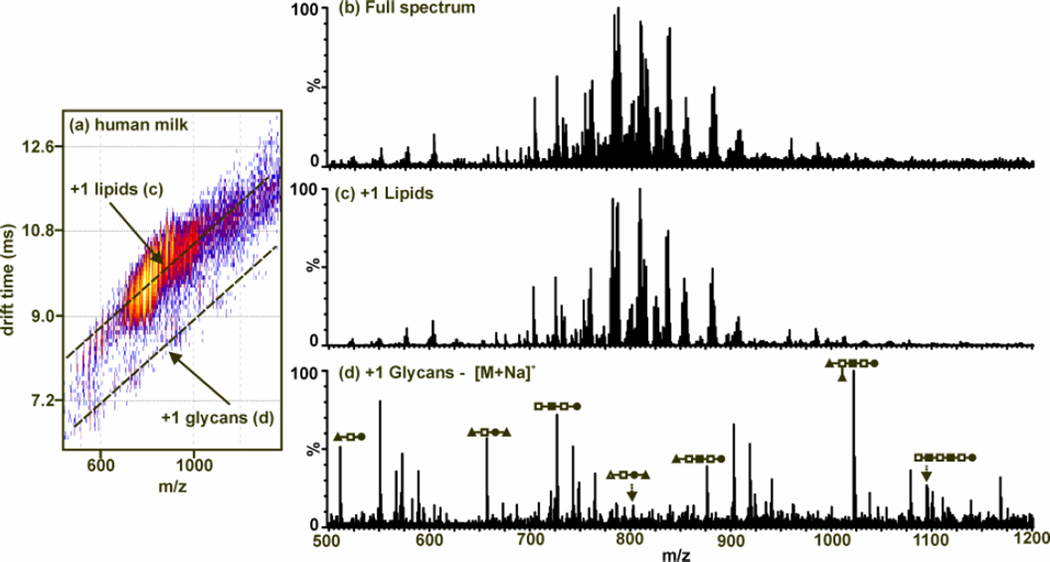
Figure 8.
MALDI-IM-MS plot and extracted mass spectra from human milk with no prior purification. (a) A 2D IM-MS plot of conformation space. Structural separations are observed for lipids [labeled (c)] and glycans [labeled (d)]. Since MALDI is used, all identified peaks correspond to singly-charged species. (b) An integrated mass spectrum for all of conformation space. This is what would be seen if using MS alone to characterize the human milk sample. (c) An extracted mass spectrum corresponding to lipids [along top dashed-line in (a)]. (d) An extracted mass spectrum corresponding to glycans [along bottom dashed-line in (a)]. Carbohydrate structure representations are as follows: ●-glucose, Δ-sialic acid, ■-N-acetylglucosamine, □-galactose, and ▲-fucose. Adapted from (89).

