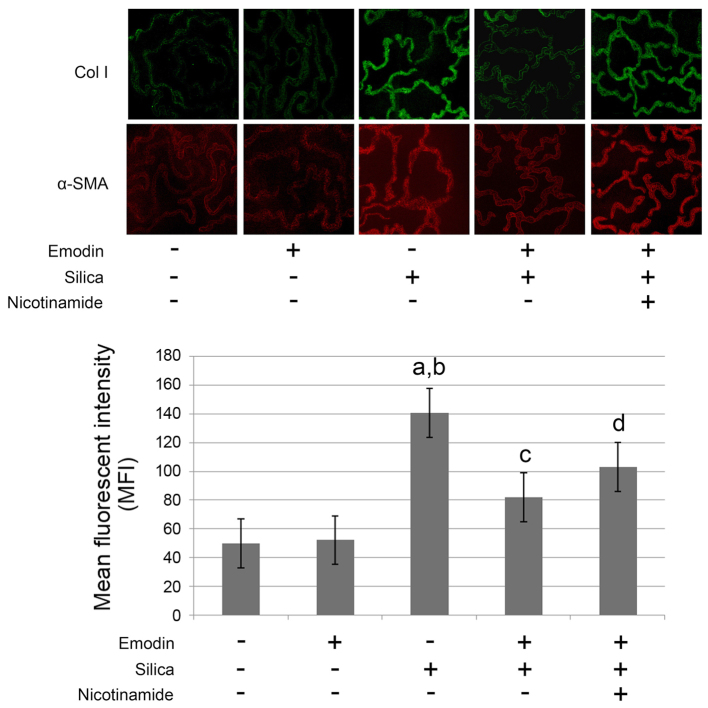
Figure 1.
Images captured of the fluorescent staining of Col I and α-SMA in lungs harvested from mice with silica inhalation-induced lung fibrosis treated with emodin and/or nicotinamide. The graph below shows the intensity of Col I and α-SMA fluorescent staining, presented as the mean ± standard deviation. Magnification, ×200. aP<0.05, compared with the untreated control; bP<0.05, compared with the emodin-treated group; cP<0.05, compared with the silica-exposed group; dP<0.05, compared with the emodin-treated silica-exposed group. Col I, collagen I; α-SMA, α-smooth muscle actin.

