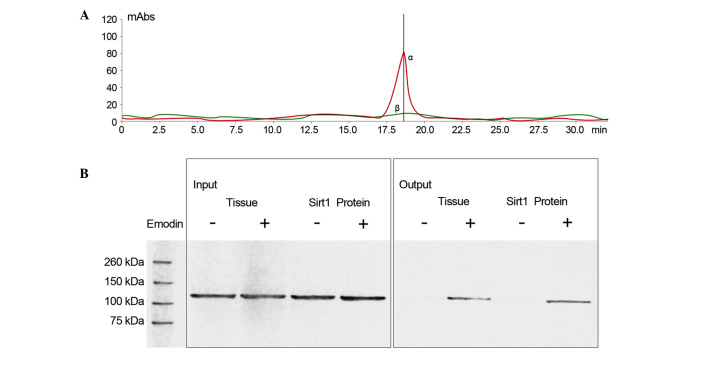
Figure 3.
(A) Liquid chromatography-mass spectrometry detection of emodin eluted from Sirt1-loaded affinity columns. The α peak (in red curve) and β peak (in green curve) indicate the detected samples from the control and emodin-bound Sirt1-loaded columns, respectively. The α peak represents the specific peak for emodin. (B) Immunoblots of Sirt1 further confirmed the direct binding of emodin to Sirt1. ‘-’ indicates non-emodin-loaded affinity columns, ‘+’ indicates emodin-loaded affinity columns. The samples comprised lung tissue lysate and Sirt1 protein. mAbs, monoclonal antibodies; Sirt1, surtuin 1.

