
Figure 2. Whole brain projection patterns from seven representative cortical regions.
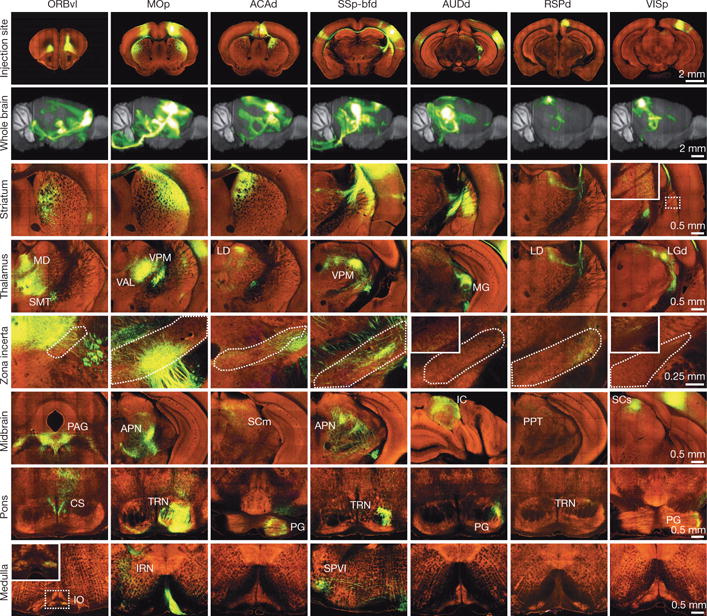
One coronal section at the centre of each injection site is shown in the top row (see Supplementary Table 1 for the full name of each region). In the second row, 3D thumbnails of signal density projected onto a sagittal view of the brain reveal differences in brain-wide projection patterns. The bottom 6 rows show examples of EGFP-labelled axons in representative subcortical regions.