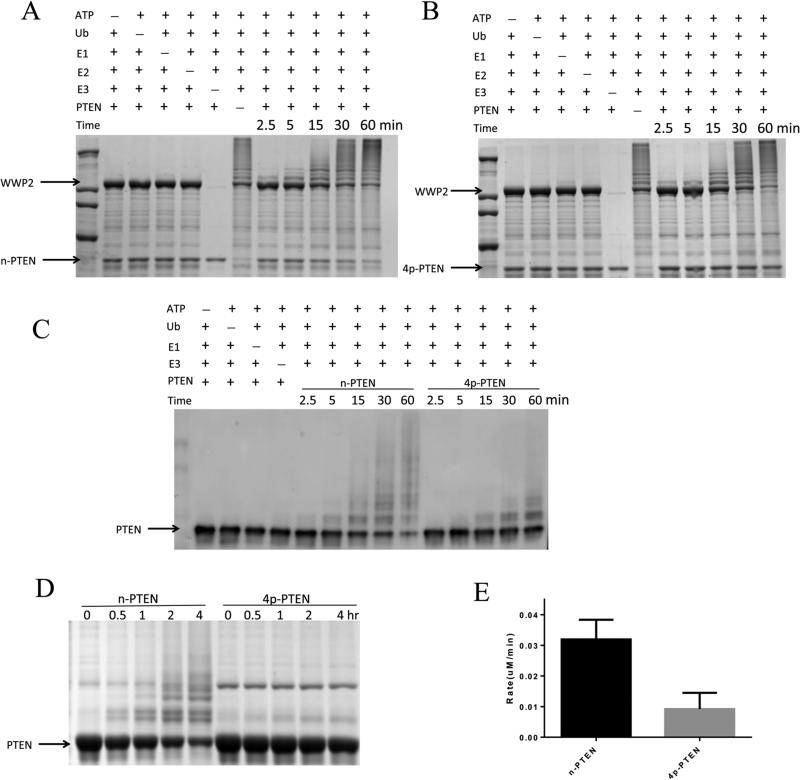
Figure 2.
In vitro ubiquitylation assay of n-PTEN and 4p-PTEN by WWP2. (A) In vitro ubiquitylation assay for n-PTEN. The reaction was conducted in the presence of 5 mM ATP, 100 μM wild-type ubiquitin, 50 nM E1, 1 μM E2 (UbcH5c), 1 μM WWP2, and 1 μM n-PTEN in assay buffer with 40 mM HEPES (pH 7.5) and 5 mM MgCl2. The reaction was quenched at 2.5, 5, 15, 30, and 60 min. Negative controls without ATP, ubiquitin, E1, E2, E3, or PTEN were assayed. The samples were resolved by SDS–PAGE, and the gel was stained with colloidal blue. (B) In vitro ubiquitylation assay for 4p-PTEN. The reaction was conducted for 4p-PTEN using the same conditions as in panel A. (C) n-PTEN and 4p-PTEN ubiquitylation analyzed by Western blotting using the anti-PTEN antibody. E2 was added to these experiments, but the minus E2 conditions are not shown in this blot. (D) In vitro ubiquitylation assay for n-PTEN and 4p-PTEN. The reaction conditions were the same as in panel A except that 10 μM PTEN was used instead of 1 μM PTEN. Ubiquitylation of PTEN at time points of 0, 0.5, 1, 2, and 4 h was analyzed by colloidal blue staining. (E) Quantification of the rate of PTEN ubiquitylation. The ubiquitylation assay performed in panel D was quantified by measuring the decrease in nonubiquitylated PTEN band intensities and calculating the decrease in nonubiquitylated PTEN protein levels as a function of time over replicates (n = 3) with the standard error shown.

