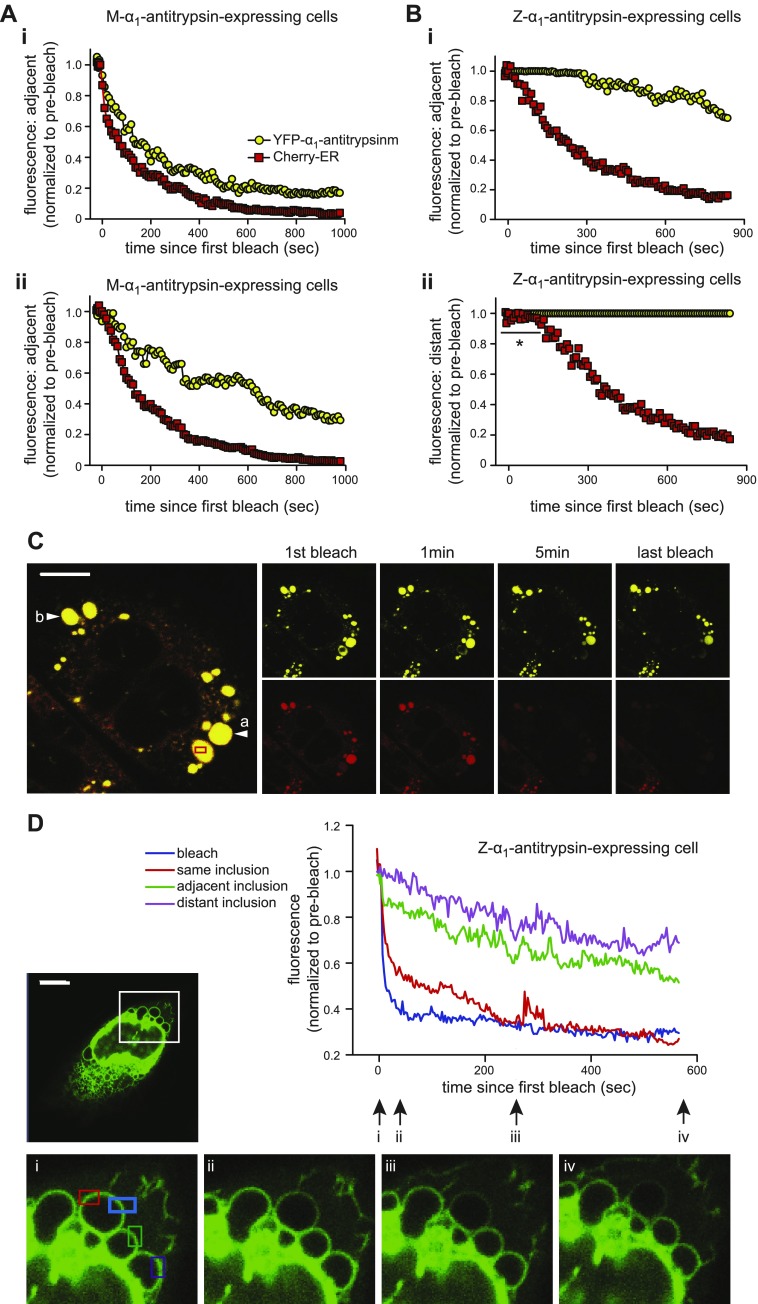
Figure 4.
Neither lumens nor membranes of inclusions are connected. A) FLIP in CHO cells expressing M-α1-antitrypsin (yellow circles) and mCherry-ER (red squares). Single region of interest of 5–10% area of cell was bleached repetitively, and fluorescence of each fluorophore was measured at adjacent (6 µm) (i) and distant (40 µm) (ii) sites within cell. Both mCherry and YFP fluorescence was immediately lost throughout cell. B) FLIP of CHO cells expressing YFP-Z-α1-antitrypsin (yellow circles) and mCherry-ER (red squares). Region of interest within single inclusion was repetitively bleached, and fluorescence was measured in adjacent (i) and distant (ii) inclusion. Delay was present before loss of YFP-Z-α1-antitrypsin fluorescence from adjacent inclusion (i) vs. persistence of fluorescence in distant inclusion (ii). Marked delay (indicated with an asterisk) was noted before loss of mCherry-ER fluorescence from distant inclusion (ii). C) Representative images of YFP-Z-α1-antitrypsin photobleaching experiment: bleaching region of interest (red box); adjacent inclusion (arrow a), distant inclusion (arrow b). Scale bar, 10 µm. D) FLIP of cells expressing untagged Z-α1-antitrypsin and ER membrane marker cytERM-msfGFP. Graph illustrates cytERM-msfGFP fluorescence at bleached area (blue); 2 equidistant regions of interest, one on same inclusion (red); one on adjacent inclusion (green); and another on distant inclusion (purple). Inset: whole cell and 4 high-powered views of bleaching area at times i to iv marked on graph. Scale bar, 10 µm.

