Figure 2.
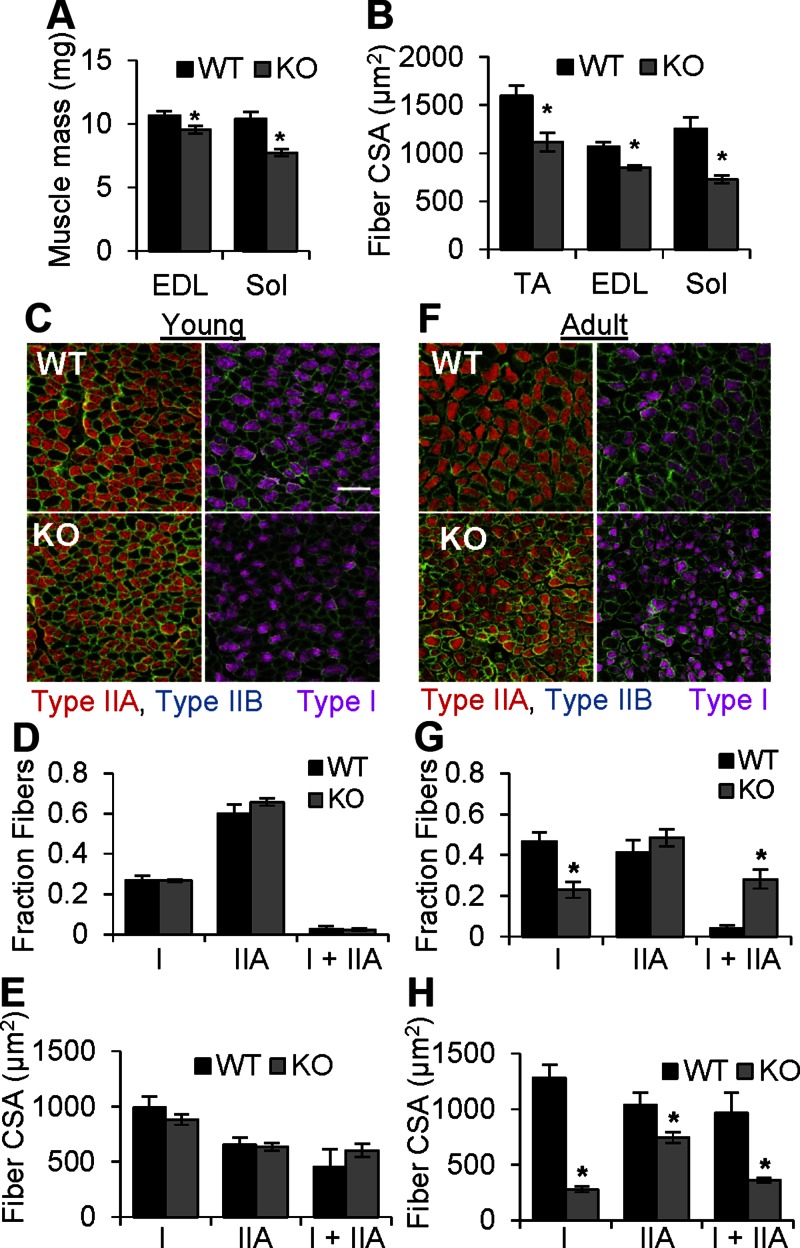
Sol muscles from Orai-KO mice develop normally and subsequently undergo fiber type-specific atrophy. A) Average weights of EDL and Sol muscles from WT and cOrai-KO mice (n = 25–36 muscles). B) Average fiber CSA in TA, EDL, and Sol muscle sections from WT and cOrai-KO mice (n = 3–6 animals). C, F) Top: sections of Sol muscles taken from young (C) and adult (F) WT animals. Bottom: sections of Sol muscles taken from young (C) and adult (F) cOrai-KO animals. Sections were stained for type I (magenta), type IIB (blue), and type IIA (red) myosin isotypes. Dystrophin (green) was used as marker of sarcolemma. Scale bar, 100 μm (white line) shown in applies to all images. D, G) Fractional contribution of fibers containing only type I, only type IIA, or both type I and type IIA myosin in Sol muscles from young (D) or adult (G) WT and cOrai-KO mice (n = 4–7 animals). E, H) Average CSA of different fiber types in Sol muscles from young (E) or adult (H) WT and cOrai-KO mice (n = 4–7 animals).

