Figure 5.
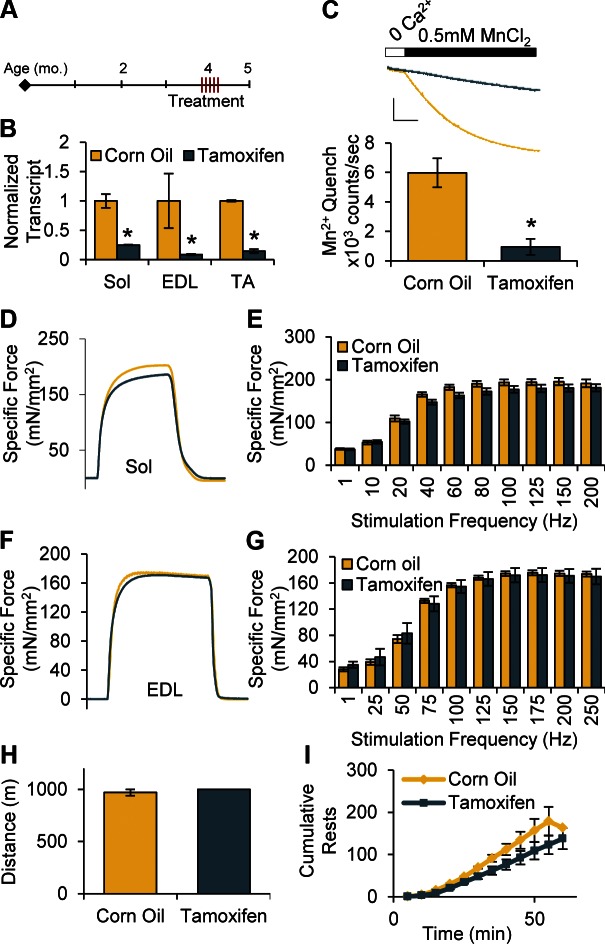
Despite significant reductions in Orai1 transcript, force generation and whole-animal fatigue do not differ at 1 mo after Tam administration. A) Four-month-old animals were given 5 injections on 5 consecutive days of Tam (40 mg/kg/d) or equivalent volume of CO (vehicle), then collected and measured 1 mo later. B) Orai1 transcript normalized to Cacna1s transcript in Sol, EDL, and TA muscles isolated from mice 1 mo after 5 injections of CO or Tam (n = 3 animals). C) Representative Mn2+ quench traces (top; scale bars: x = 100 s, y = 4 × 10⁵ counts) and maximal rate of Mn2+ quench in isolated FDB fibers (n = 6–9 cells from 2 animals). D, F) Representative traces of ex vivo force generation by Sol (D) and EDL (F) stimulated at 150 Hz for 500 ms. E, G) Maximal specific force-frequency summary generated by excised Sol (E) and EDL (G) muscles (n = 3–7 muscles). H, I) Total treadmill distance run (H) and cumulative number of rests taken (I) by CO- and Tam-injected mice during 1 h endurance treadmill protocol (n = 3–4 animals).

