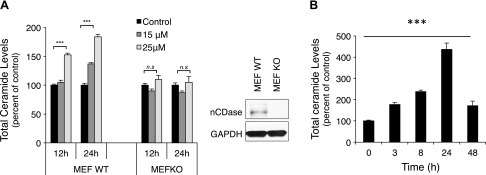
Figure 2.
Effects of nCDase inhibition on lipid levels. A) MEF WT and MEF KO for nCDase cells were treated with 15 and 25 μM C6 urea-ceramide, and total ceramide levels were measured at 12 and 24 h (right panel confirms the MEF KO for nCDase by Western blot). Lipid basal levels for MEF WT were 2.06 ± 0.58 pmol/nmol Pi for total ceramide, 0.141 ± 0.0325 pmol/nmol Pi for SPH, and 0.0164 ± 0.004 pmol/nmol Pi for S1P. Lipid basal levels for MEF KO were 2.98 ± 0.43 pmol/nmol Pi for total ceramide, 0.102 ± 0.025 pmol/nmol Pi for SPH, and 0.0176 ± 0.003 pmol/nmol Pi for S1P. B) HT29 cells were treated with C6 urea-ceramide (10 μM), and lipids were evaluated at the indicated times. Lipid analysis was performed using high-performance liquid chromatography-electrospray ionization-mass spectrometry (HPLC-ESI-MS) at the Lipidomics Core Facility at Stony Brook University. Data are shown as means ± sem. A 2-way ANOVA was used to analyze the data in A, and a 1-way ANOVA was used to analyze the data in B. Results are representative of 3 experiments. ***P < 0.0001.

