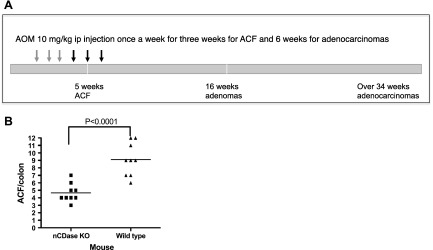
Figure 5.
Effect of nCDase deficiency on AOM-induced ACF formation. A) Scheme of treatment with AOM and time points when mice were euthanized. Colons were collected for ACF, adenoma, and adenocarcinoma evaluation. B) ACF formation in nCDase-KO mice vs. WT mice. Bars represent group median; symbols represent ACF numbers per animal. A 2-tailed Student’s t test was used to analyze the data in B (9 mice per group).

