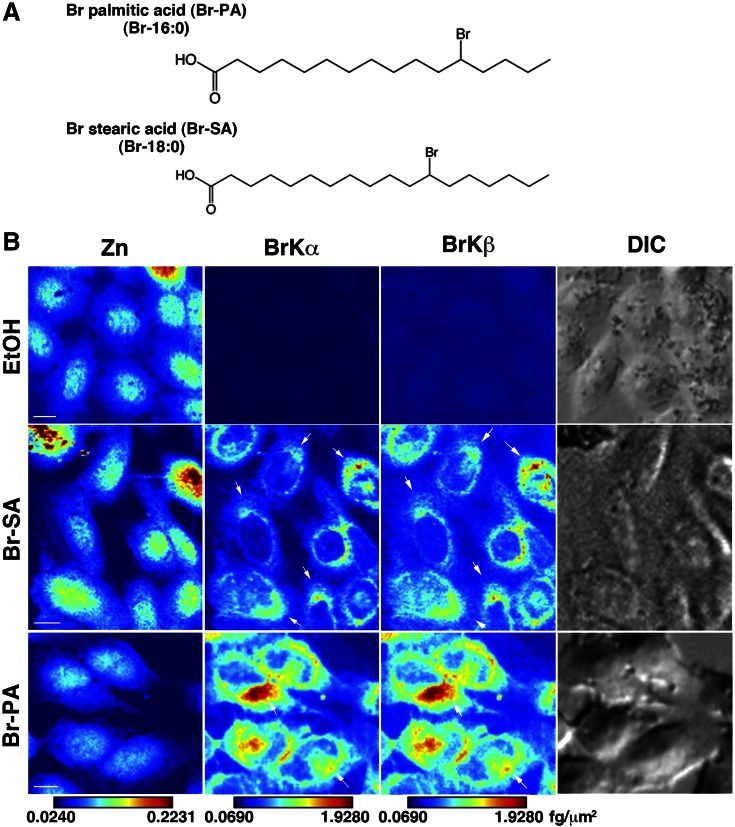
Figure 1.
X-ray fluorescence images of Br-labeled fatty acids. A) Schematic structure of the Br-labeled fatty acids. B) Zn- and Br-mapping images of Br-SA-, Br-PA-, and EtOH-treated CHO-K1 cells. Cells were treated with 2.1 µM Br-SA and 3.2 µM Br-PA for 24 h. Arrows indicate the Br signals, which tended to be clustered. Zn, zinc; BrKα and Brkβ, bromine X-ray emission lines; DIC, differential interference contrast image. Br-SA, cells treated with Br-labeled stearic acid; Br-PA, cells treated with Br-labeled palmitic acid. A brighter color indicates higher signal intensity. Color bar, femtograms per square micrometer; scale bar, 10 μm.

