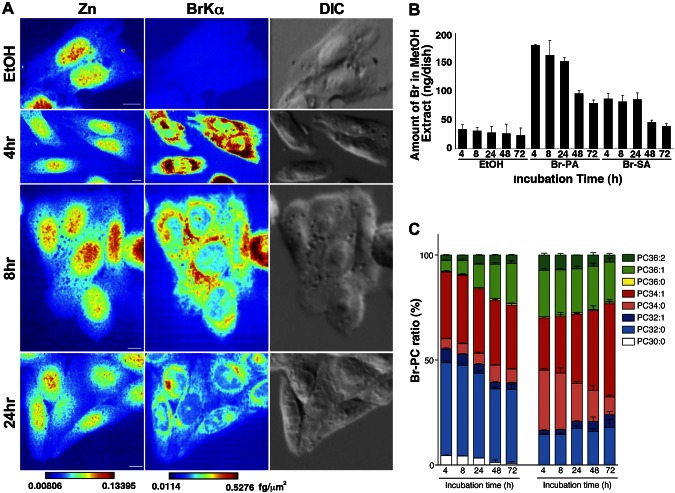
Figure 3.
X-ray fluorescence images of cells with pulse labeling of Br-labeled fatty acids. A) Zn- and BrKα-mapping images of CHO-K1 cells pulse labeled for 4 h with 3.2 µM Br-PA followed by washing. BrKα, a bromine X-ray emission line; DIC, differential interference contrast image; Zn, zinc. A brighter color indicates higher signal intensity. Color bar, femtograms per square micrometer; scale bar, 10 μm. B) ICP-MS measurement analyses of cells pulse labeled with Br-labeled fatty acids. CHO-K1 cells pulse-labeled for 4 h with 3.2 µM Br-PA or 2.1 µM Br-SA followed by washing. Br contents of MeOH extracts according to incubation time after 4 h of pulse labeling with Br-labeled fatty acids. C) Percent ratios of Br-PC; the 8 major PC species indicated were measured by LC-MS; 100% on the y axis indicates the sum of each PC peak area. Data were obtained from 3 independent experiments. Data are given as means + sem (n = 3). Br-PA, cells treated with Br-labeled palmitic acid; Br-SA, cells treated with Br-labeled stearic acid; EtOH, EtOH-treated cells; PC, phosphatidylcholine.

