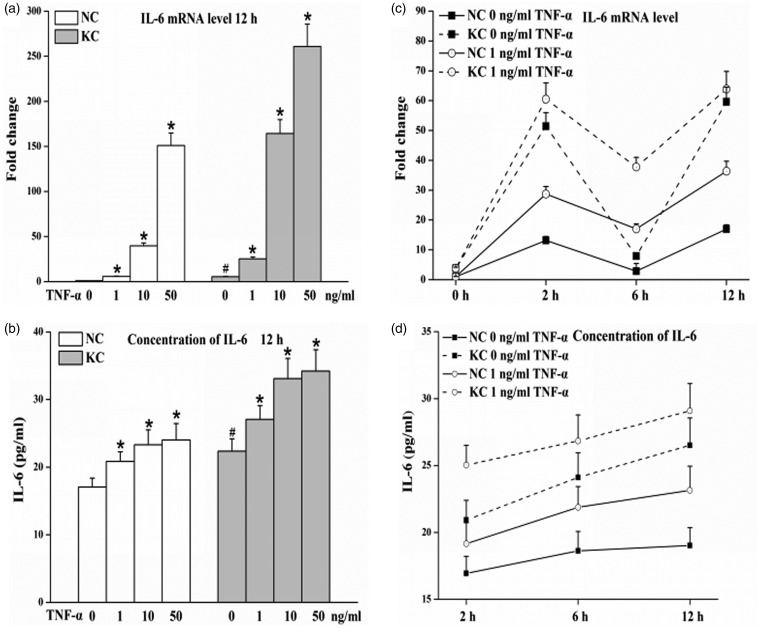
Figure 2.
Levels of IL-6 in fibroblasts of normal cornea (n = 3) and keratoconus (n = 3) cultured with TNF-α. Cells were treated with various TNF-α concentrations for 12 h or incubated with the absence or presence of 1 ng/mL TNF-α for various incubation times. Total RNA and cell-culture supernatants were then collected. (a and c) IL-6 mRNA levels determined by real-time PCR from total RNA. (b and d) IL-6 protein in supernatants measured using a human IL-6 ELISA kit. Values are presented as mean ± standard deviation of three independent experiments. KC: keratoconus, NC: normal cornea. Cells without TNF-α treatment were used as control. *P < 0.05, compared with their own control group; #P < 0.05, KC control vs. NC control

