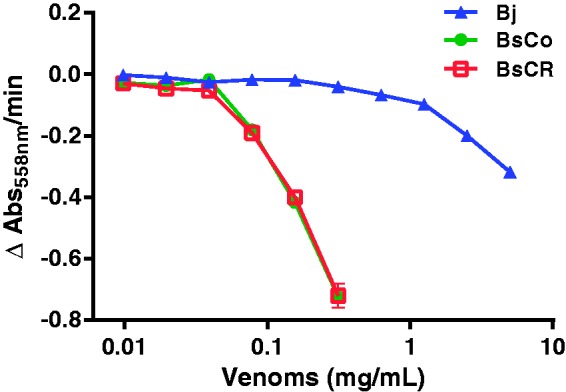
Figure 4.

Curves of PLA2 activity of venoms from B. jararaca (Bj), B. schlegelii from Colombia (BsCo) and Costa Rica (BsCR). Note the strong activity of BsCo and BsCR compared to Bj. Each point represents the mean ± SEM of triplicate determinations of two different experiments. (A color version of this figure is available in the online journal.)
