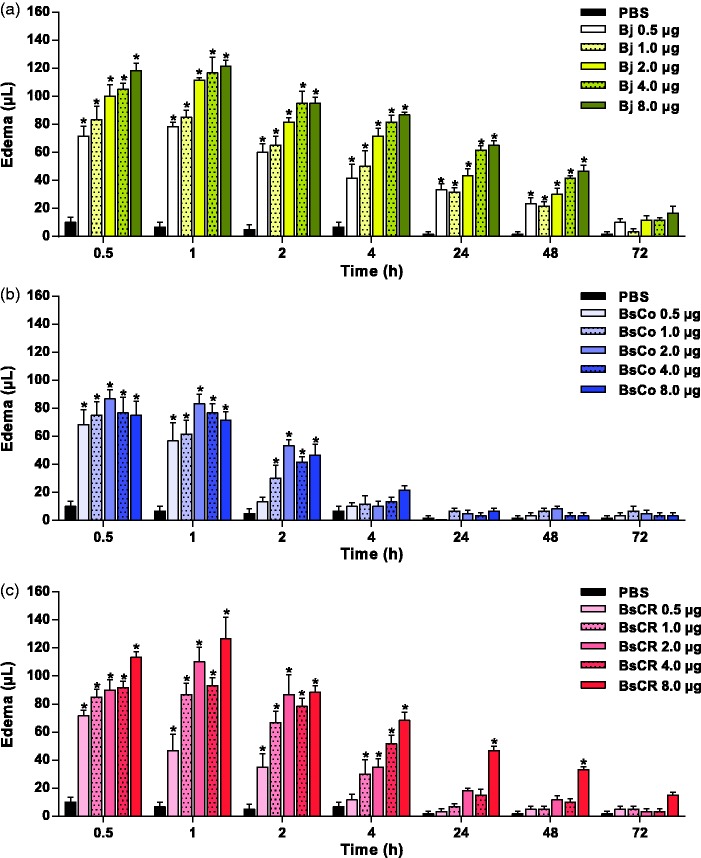
Figure 5.
Edematogenic activity induced by the venoms of (a) B. jararaca (Bj), (b) B. schlegelii from Colombia (BsCo) and (c) Costa Rica (BsCR). Edema was calculated by pletysmometry at different times by the difference of volume displaced (µL) by the paws of animals (n = 6) before and after sample injection. The results were expressed as mean ± SEM. PBS was used as negative control. *Differences were statistically significant (p < 0.05) when the edema induced by venom concentrations and controls (PBS or venom + IgG) was compared. (A color version of this figure is available in the online journal.)

