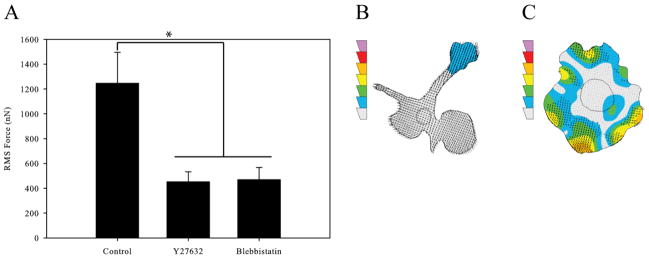
Figure 3.
Macrophage Force Generation with Rear Contraction Inhibition. (A) Root-mean-squared forces of uninhibited macrophages, macrophages inhibited with 10μM Y27632 to reduce ROCK signaling, and macrophages inhibited with 20μM Blebbistatin to reduce myosin II activity. (B) Traction contour plot of a representative cell inhibited with Y27632 imaged at 10 minutes. (C) Traction contour plot of a representative cell inhibited with Blebbistatin imaged at 340 minutes. The traction contours are plotted using the same force scale as in Figure 2A. All results from macrophages plated on 10,400Pa gels with 5μg/mL fibronectin. (n > 44 for each condition). Error bars are standard error. * indicates p < 0.05.

