Figure 4.
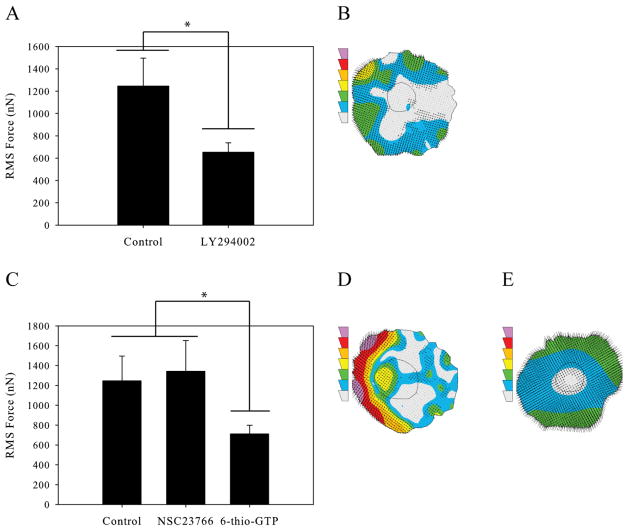
Macrophage force generation with leading edge inhibition. (A) Root-mean-squared force of uninhibited macrophages and macrophages inhibited with 50μM LY294002 to reduce PI3K signaling. (B) Traction contour plot of a representative cell inhibited with LY294002 imaged at 230 minutes. (C) Root-mean-squared force of uninhibited macrophages, macrophages inhibited with 50μM NSC23766 to reduce Rac-Tiam1 binding, and macrophages inhibited with 10μM 6-thio-GTP to block Rac-Vav1 binding. (D) Traction contour plot of a representative cell inhibited with NSC23766 imaged at 320 minutes. (E) Traction contour plot of a representative cell inhibited with 6-thio-GTP imaged at 240 minutes. The traction contours are plotted using the same force scale as in Figure 2A. All results from macrophages plated on 10,400Pa gels with 5μg/mL fibronectin. (n > 58 for each condition). Error bars are standard error. * indicates p < 0.05.

