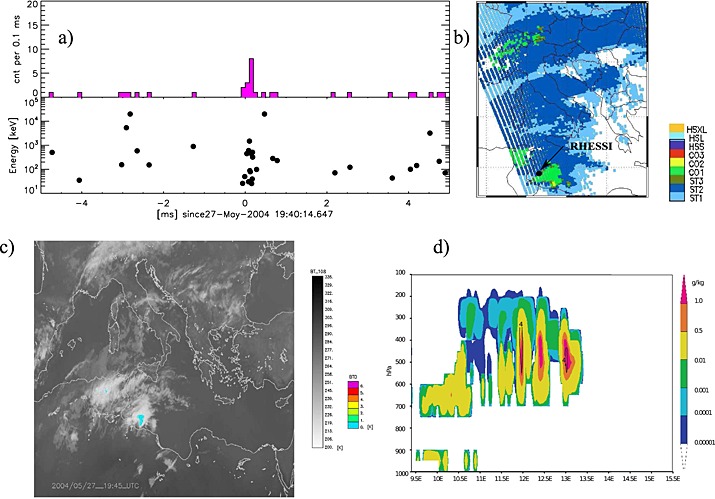
Figure 1.

(a) The lightcurve and a scatterplot of photon energy and time for the RHESSI TGFs on 27 May 2004. (b) MWCC at 20:32 UTC. A weak convection (C01) is formed close to the TGF measurements. (c) MSG 10.8 μm cloud temperature measured at 19:45 in grey scale. BTD is shown in color. The maps range is latitude 25° to 50° and longitude −5° to 40°. (d) WRF model inner grid output: cloud water and cloud ice content (colors) and vertical velocity (contours) along the cross section where the convection is more developed top, cross section at 33.75°N, at 2100 UT. For the vertical velocity, only the values w = 4,8,12 m/s are shown.
