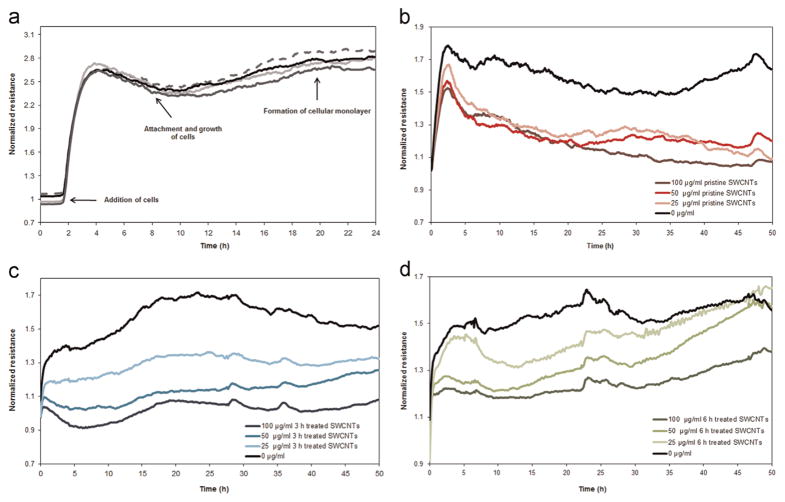
Fig. 2.
Representative real-time measurements of the normalized resistance showing changes in the cellular behavior from inoculation until the formation of a confluent monolayer (4 replicates of the cells are being shown) (a), and subsequently 48 h following exposure to (b) Pristine, (c) 3 and (d) 6h treated SWCNTs.

