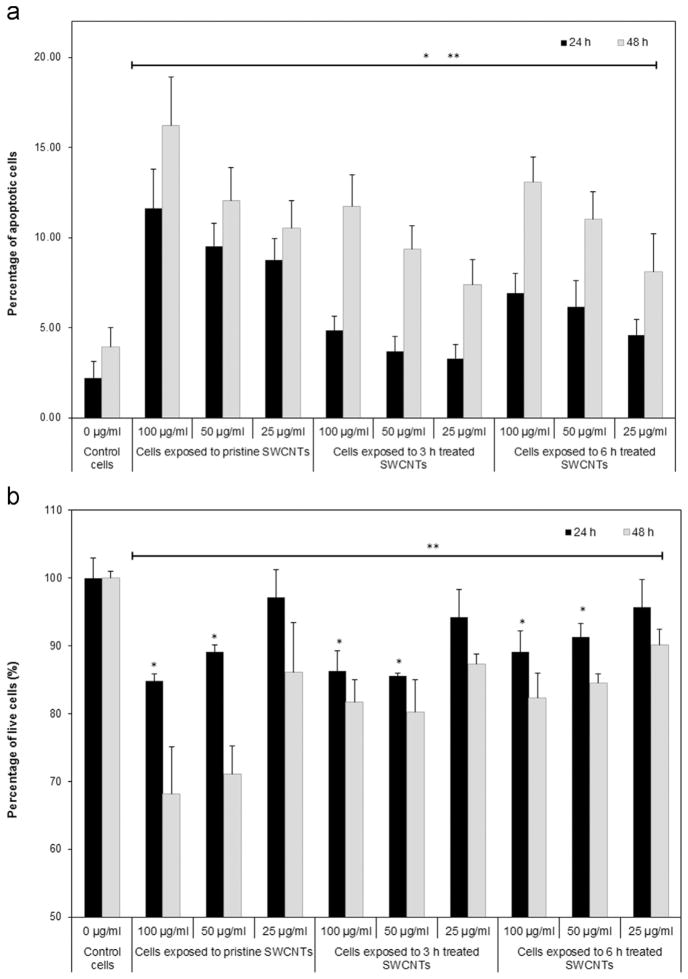
Fig. 4.
Analyzes of cellular viability following exposure to different doses of pristine, 3 and 6 h treated SWCNTs for 24 and 48 h respectively. (a) Percentage of apoptotic cells, and (b) Percentage of live cells relative to control cells. (* and ** indicate significant differences between SWCNTs-exposed cells and control cells after 24 and 48 h respectively, p<0.05).

