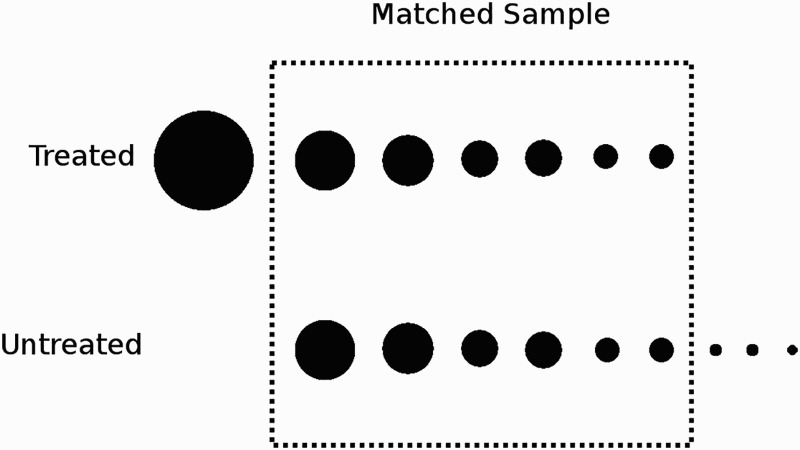
Figure 2.

Pictorial illustration of propensity matching. One method of using a propensity score to eliminate selection bias is “propensity matching.” Each circle represents one patient. The size of the circle represents the propensity score (the probability of receiving treatment). Treated patients are matched with an untreated patient with a similar propensity score. The unmatched patients are excluded. Other types of propensity methods incorporate unmatched patients.
