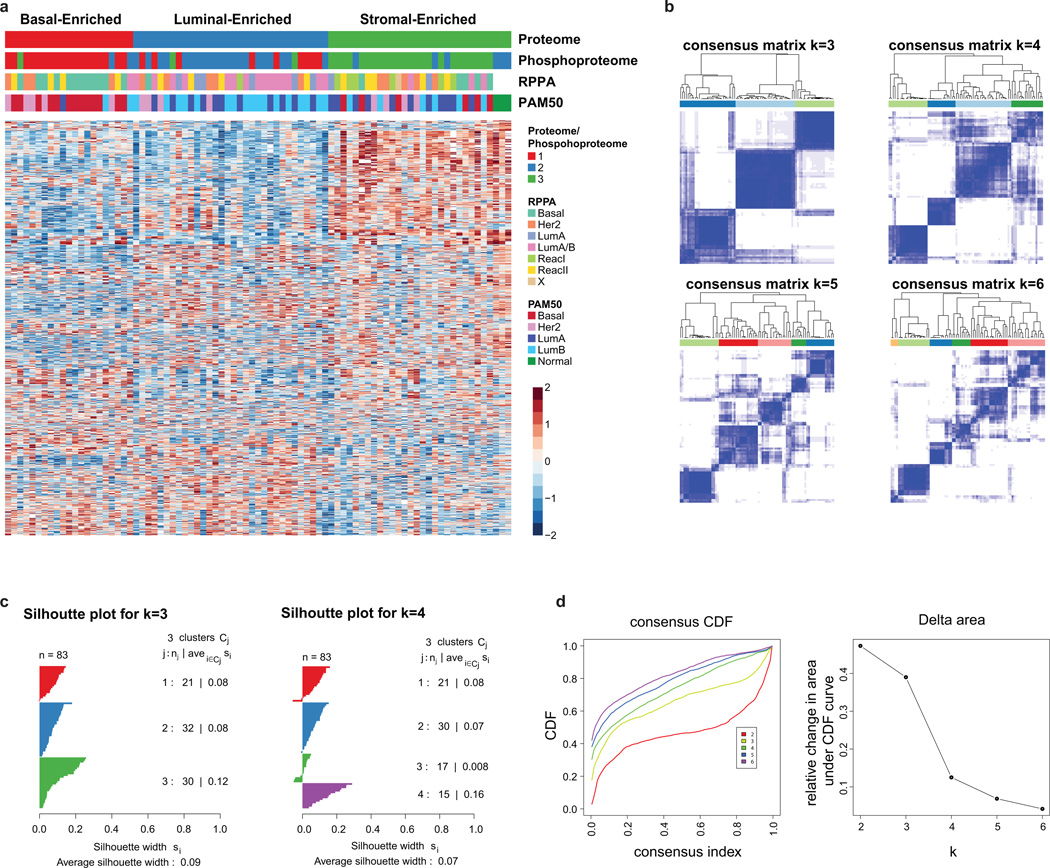
Extended Data Figure 6. Proteome cluster heatmap and stability analysis.
a, K-means consensus clustering of proteome and phosphoproteome data identifies three subgroups: basal-enriched, luminal-enriched, and stromal-enriched. The heatmap represents all 1,521 proteins used for clustering (Dataset G8). b, Identification of optimal proteome clusters for QC-passed CPTAC breast cancer tumors. Proteome clusters were derived using consensus clustering based on 1000 resampled datasets, exploring the range of 2 to 6 k-means clusters. Visualization of consensus matrices from k-means consensus clustering for k=3, 4, 5 and 6 target clusters. Consensus clustering was performed on 1,521 proteins with no missing values and SD>1.5. c, Silhouette plots were generated to evaluate the coherence of the clustering. Silhouette plots for k=3 and k=4 clusters showing a cleaner separation of clusters for k=3. d, Based on both visual inspection of the consensus matrix and the delta plot assessing change in consensus cumulative distribution function (CDF) area, three robustly segregated groups were observed. Consensus cumulative distribution function (CDF) and delta area (change in CDF area) plots for 2–6 clusters.

