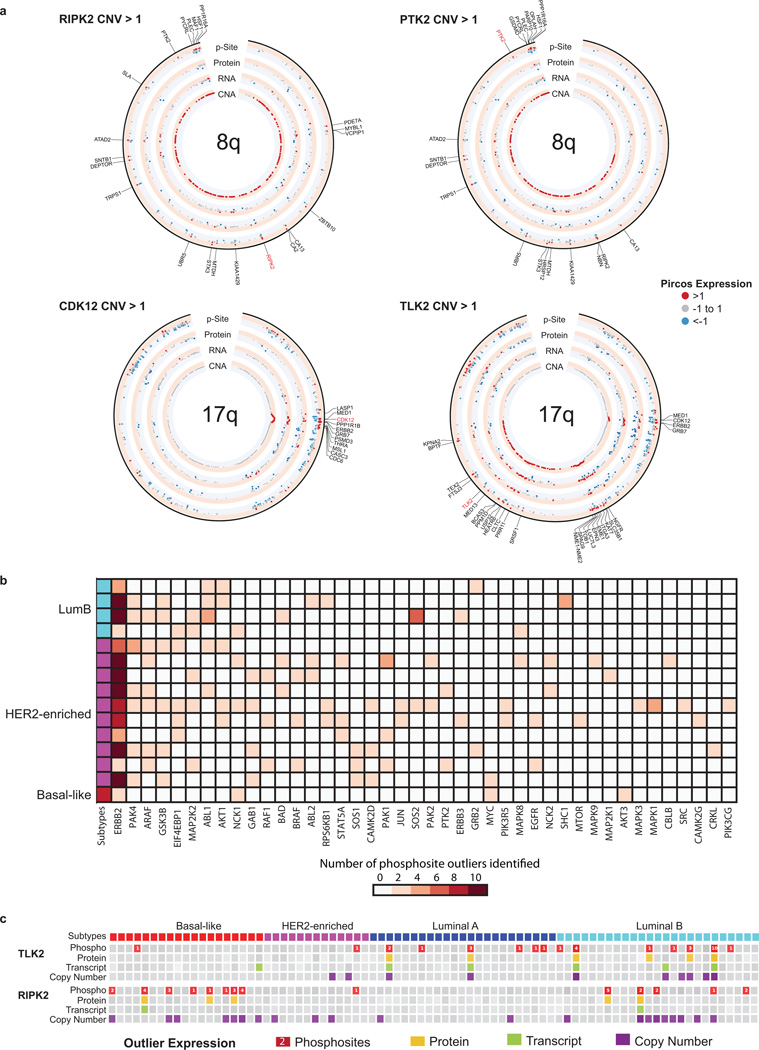
Extended Data Figure 10. PIRCOS plots, kinase outliers and outliers in the ERBB2 pathway.
a, Pircos (Proteogenomics CIRCOS) plots for 8q and 17q showing median CNA, RNA, protein, and phosphosite expression for 20 tumors with amplification in 8q based on RIPK2 CNA>1; 23 tumors with amplification in 8q based on PTK2 CNA>1; 15 tumors with amplification in 17q based on CDK12 CNA >1; and 10 tumors with amplification in 17q based on TLK2 CNA>1. Red indicates expression >1, blue < −1, and grey between −1 and 1. Genes with both copy number amplification (CNA>1) and increased phosphosite expression (p-site>1) are labeled. b, Phosphosite outliers in known ERBB2 signaling genes. To better understand the downstream effects of ERBB2 amplification, phosphosite outliers in known ERBB2 signaling genes (MSigDB pathway set, KEGG_ERBB_SIGNALING PATHWAY) were identified for the 15 samples that had ERBB2 phosphosite outlier status. Forty-one genes were identified as having a phosphosite outlier in at least one of the ERBB2 amplified samples. PAK4 and ARAF phosphosite outlier status were found in seven of the 15 ERBB2 kinase outlier samples; GSK3B outliers were found in 6 samples; and EIF4EBP1, MAP2K2, ABL1 and AKT1 outlier status was found in 5 of the 15 samples. c, Proteogenomic outlier expression analysis for TLK2 and RIPK2. Samples with outlier phosphosite (red), protein (yellow), RNA (green) and copy number (purple) expression are shown. Phosphosite squares indicate per-sample outlier phosphosites.

