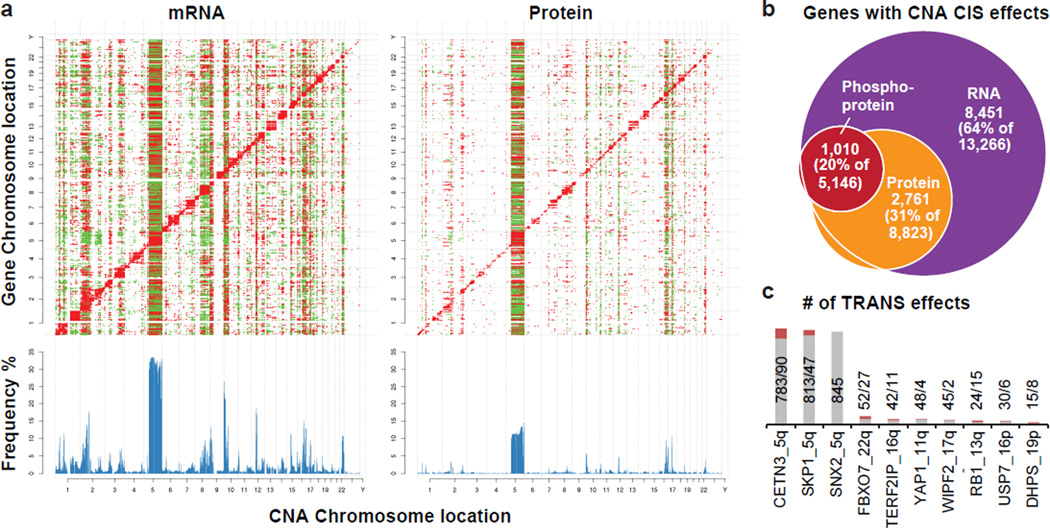
Figure 2. Effects of copy number alterations (CNA) on mRNA, protein, and phosphoprotein abundance.
a, Correlations of CNA (x-axes) to RNA and protein expression levels (y-axes) highlight new CNA cis and trans effects. Significant (FDR<0.05) positive (red) and negative (green) correlations between CNA and mRNAs or proteins are indicated. CNA cis effects appear as a red diagonal line, CNA trans effects as vertical stripes. Histograms show the fraction [%] of significant CNA trans effects for each CNA gene. b, Overlap of cis effects observed at RNA, protein, and phosphoprotein levels (FDR<0.05). c, Trans-effect regulatory candidates identified among those with significant protein cis-effects using LINCS CMap. Bars indicate total numbers of significant CNA/protein trans effects (gray; FDR<0.05) and overlap with regulated genes in LINCS knock-down profiles (red; 4 cell lines; moderated T-test FDR<0.1).

