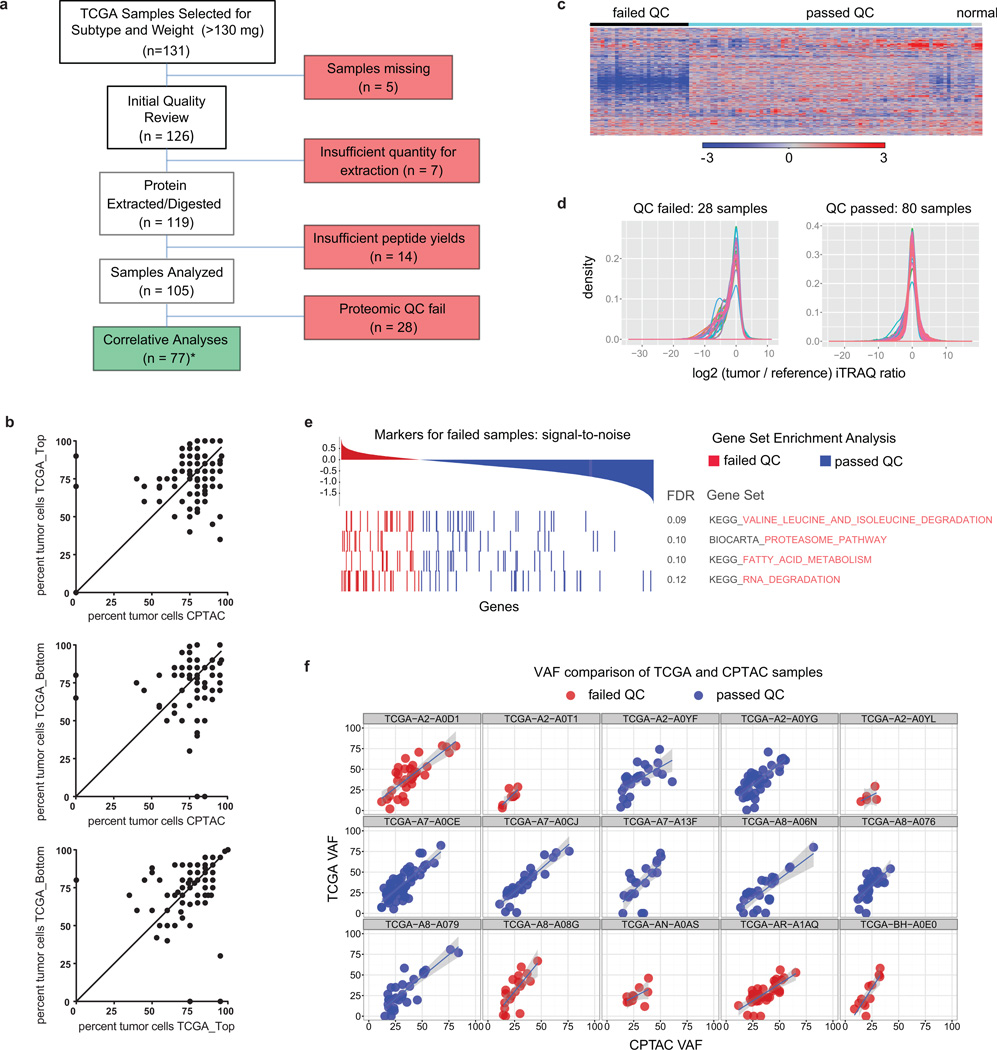
Extended Data Figure 2. Tumor sample quality control (I).
a, Remark diagram showing sample processing and partitioning. Initial quality review encompassed histopathological examination of H&E stained tissue slices. *For 3 samples no tumor cells were seen on histopathology (BH-A0E9, BH-A0C1, A2-A0SW). These samples were nevertheless included in the proteome analysis since other quality control standards were met (see below) and samples with 0% tumor cellularity on top or bottom sections were included in TCGA analyses. b, correlation of TCGA (top or bottom sections) and CPTAC histological assessment of neoplastic cellularity for samples (n = 105). The average and range of neoplastic cellularities were identical for CPTAC and TCGA histological assessments. Averages (standard deviations) for neoplastic cellularity were 76% (+/− 17) for CPTAC, 76% (+/− 15) for TCGA_Top, and 75% (+/− 18) for TCGA_Bottom histopathology slides (Supplementary Table 2). Note that in three CPTAC cases where no tumor cells were identified by histopathological assessment, numbers of protein-level somatic variants were similar to all other tumors. The identified mutated proteins were TP53_R273C, NOP58_Q23E, TAGLN2_G154R, TUBA1B_D116H, and MRPL48_I173K (Supplementary Table 5), indicating presence of tumor cells in these samples. c, Proteome iTRAQ tumor/internal reference ratio heatmap for all CPTAC samples (8,028 proteins without missing values) including passed and failed proteomic quality control (QC) samples. d, Global tumor/reference proteome ratio distributions for samples that passed and failed proteomic quality control analysis. e, Degradation-related gene sets were enriched in tumors that failed proteomic quality control analysis. f, Variant allele frequency (VAF) analysis of re-sequenced CPTAC tumors and comparison to original TCGA data. Overall VAFs for failed QC samples were lower compared to passed samples suggesting lower purity.

