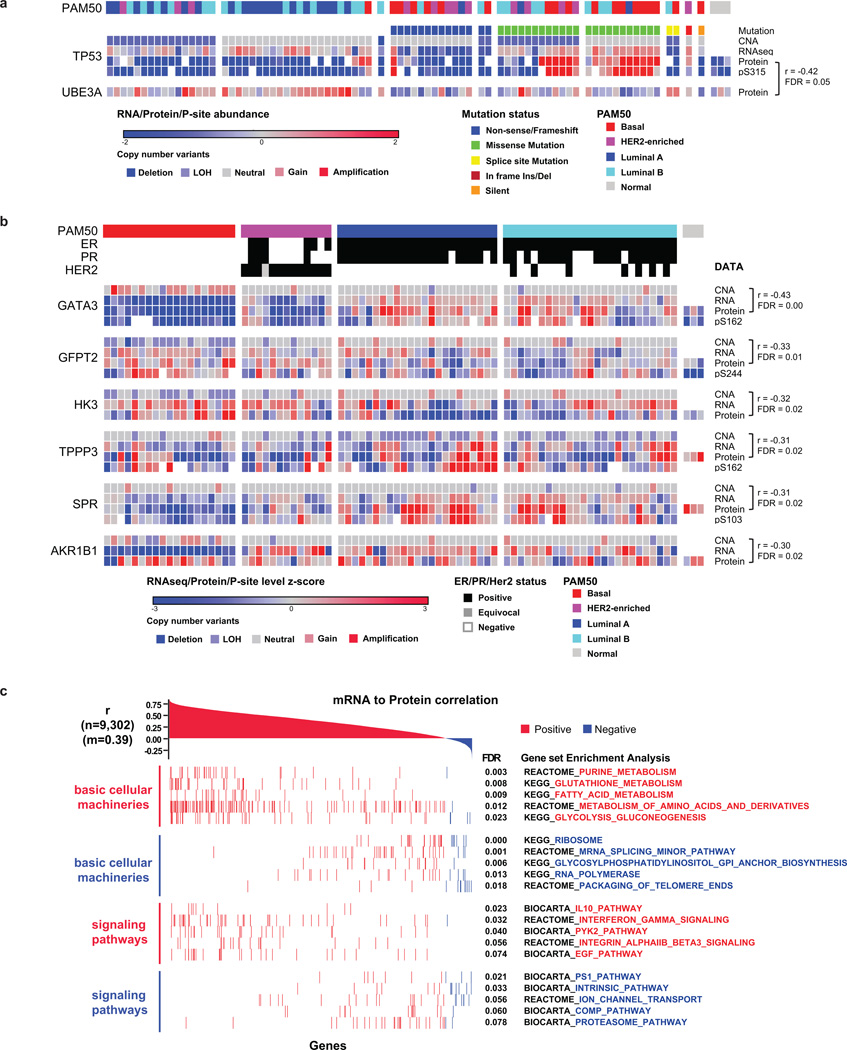
Extended Data Figure 4. Protein-to-Protein, -CNA, and -mRNA correlation analyses.
a, Identification of UBE3A as an E3 ubiquitin ligase that negatively correlates to p53 on the protein level. Pearson correlation and Benjamini-Hochberg corrected p-value are shown. b, Analysis of counter-regulated genes with negative correlation of CNA-to-RNA as well as CNA-to-protein levels. Negative Pearson correlations are shown with Benjamini-Hochberg corrected p-values for CNA-to-protein correlations. Depicted genes have significant negative correlations at FDR<0.05 in the CNA-to-RNA and CNA-to-protein analyses. c, Global mRNA-to-protein correlation and gene set enrichment analysis.

