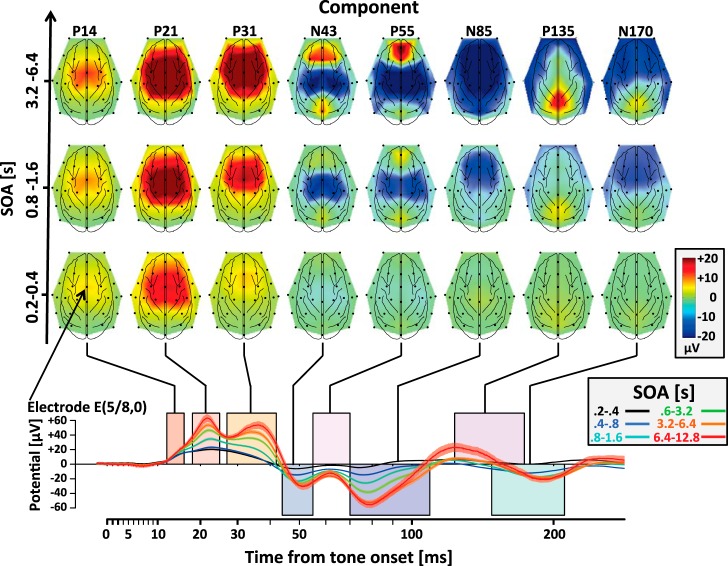
Fig. 5.
Topography and component amplitude as a function of SOA. Bottom, responses of electrode E(5/8,0) as a function of time from tone onset. Different colored traces correspond to tones in different ranges of SOA. The colored rectangles indicate the time windows that were previously assigned to the 8 different middle- and long-latency components. Note that in this animal there was no specific peak associated with the P14 component. Top: highlighted topography for the different components as a function of SOA for 3 example bins of SOA.

