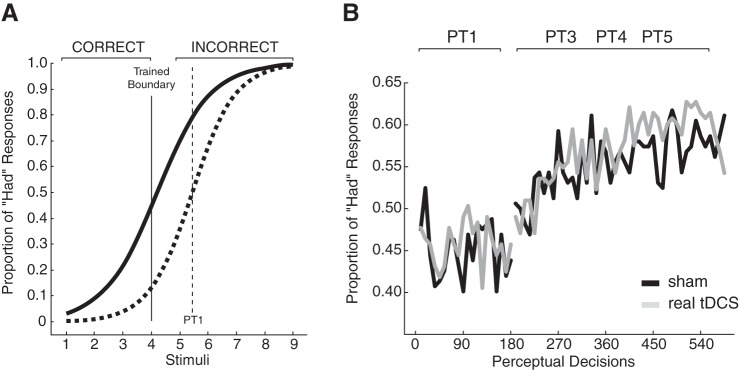
Fig. 2.
Feedback altered perceptual responses. A: during perceptual training, feedback was delivered around a new perceptual boundary (solid vertical line) that was set lower than the perceptual boundary (broken vertical line) measured during the baseline head-to-had perceptual test. In this example, “CORRECT” was displayed on the screen if the participant perceived stimuli 1–4 as head, and “INCORRECT” was displayed if the stimuli were perceived as had. CORRECT was displayed on the screen if participants perceived stimuli 5–9 as had, and INCORRECT was displayed on the screen if they were perceived as head. B: the proportion of had responses (y-axis) was computed for blocks of 9 stimuli for the baseline head-to-had perceptual test (PT1) and during perceptual training (PT3-PT5). The introduction of feedback led to a learned increase in the proportion of had responses. The gray lines represent the group that received transcranial direct current stimulation (tDCS); the black lines represent the group that received sham stimulation.

