Fig. 5.
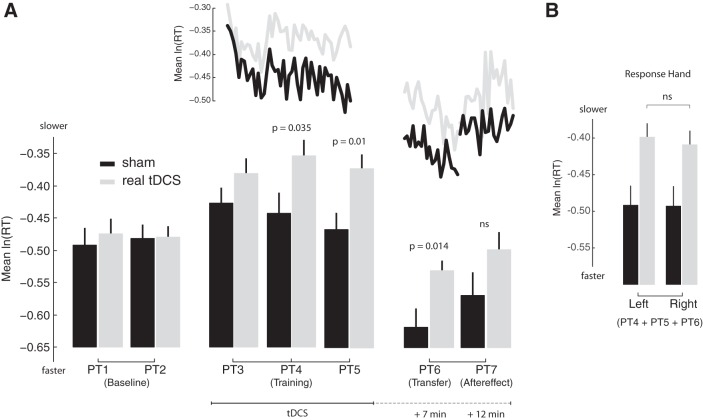
Cerebellar tDCS slowed reaction times. A: the mean (log-normalized) reaction time is displayed for each perceptual test. The gray bars represent the group that received cerebellar tDCS. The black bars represent the group that received sham tDCS. The approximate timing of the transfer, aftereffect, and retention tests in relation to tDCS and perceptual learning is indicated on the bottom. The application of cerebellar tDCS caused a reaction time difference between the groups (PT3–PT5). This difference was still present during the transfer test that occurred 7 min after tDCS. To visualize how reaction times evolved during training and transfer and the aftereffect test, log-normalized reaction times associated with blocks of 9 perceptual decisions were averaged and joined via the gray lines (real stimulation) and black lines (sham stimulation) at the top. B: average reaction times from PT4, PT5, and PT6 were pooled for left and right hand responses and compared between the groups. A similar tDCS-related difference in reaction time was observed for left and right hand responses.

