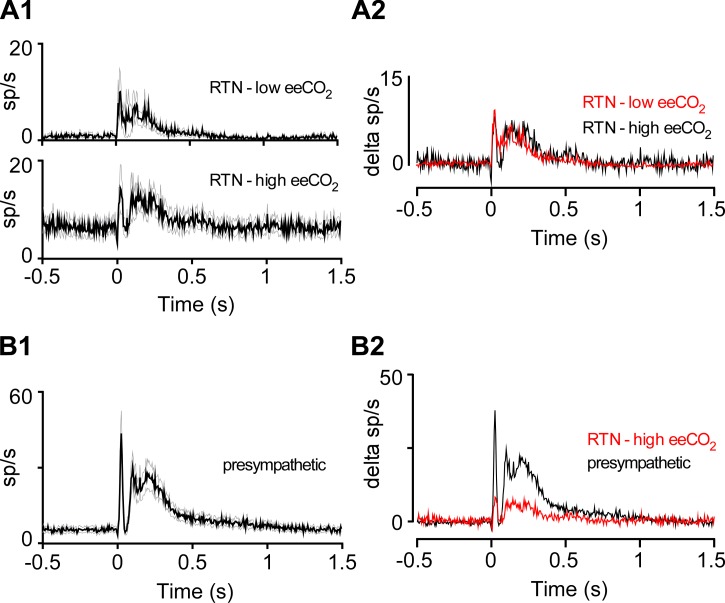
Fig. 10.
Sciatic nerve stimulation produces larger evoked responses in presympathetic than RTN neurons. A1: average responses (black trace and gray lines: mean and SE) evoked by contralateral sciatic nerve stimulation (delivered at time 0) in RTN neurons at high (n = 15) vs. low (n = 19) eeCO2. A2: evoked responses at high and low eeCO2 superimposed to emphasize similarity. y-Axis indicates change in discharge rate relative to prestimulation baseline. B1: average response evoked in 25 presympathetic neurons by contralateral sciatic nerve stimulation. B2: responses evoked in 25 presympathetic neurons and 19 RTN neurons (high eeCO2, from A1) superimposed to emphasize differences in magnitude of response. y-Axis indicates change in discharge rate relative to prestimulation baseline.

