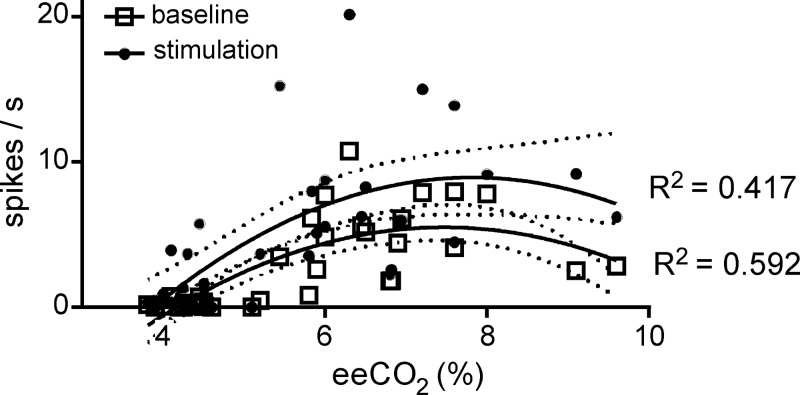
Fig. 11.
Sciatic nerve stimulation shifts the relationship between RTN firing rate and eeCO2 upward. Firing rate of all recorded RTN neurons before (open squares) and during 5-min sciatic nerve stimulation at 0.5 Hz (filled circles) plotted as a function of eeCO2. A nonlinear second-order polynomial curve was fitted with the least squares method. Coefficients of regression are indicated, and 95% confidence intervals are depicted by dotted lines.

