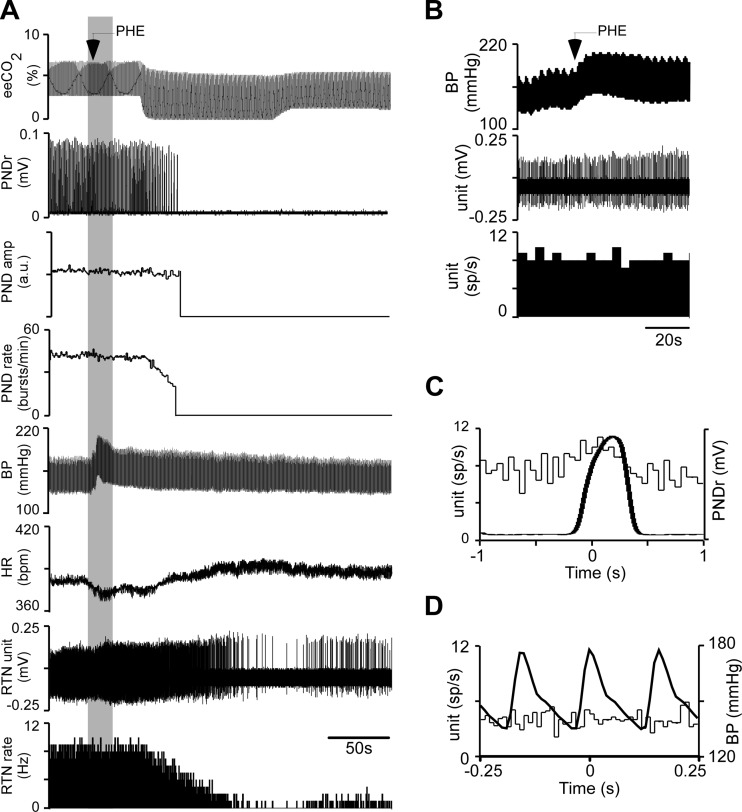
Fig. 3.
RTN neuron characterization. A: original recording showing the effect of CO2 and phenylephrine (PHE; 5 μg/kg iv) on the discharge of a single RTN neuron. Traces presented as in Fig. 2. The unit was silent below 5% eeCO2 but unresponsive to BP elevation. B: expanded timescale excerpt (from shaded period in A) illustrating the lack of effect of PHE. C: PND-triggered histogram of the activity of the unit represented in A. Note weak respiratory modulation with activity nadir during postinspiration. D: pulse-triggered activity histogram (thin trace) and superimposed averaged pressure pulse illustrating the absence of pulse modulation of this unit.

