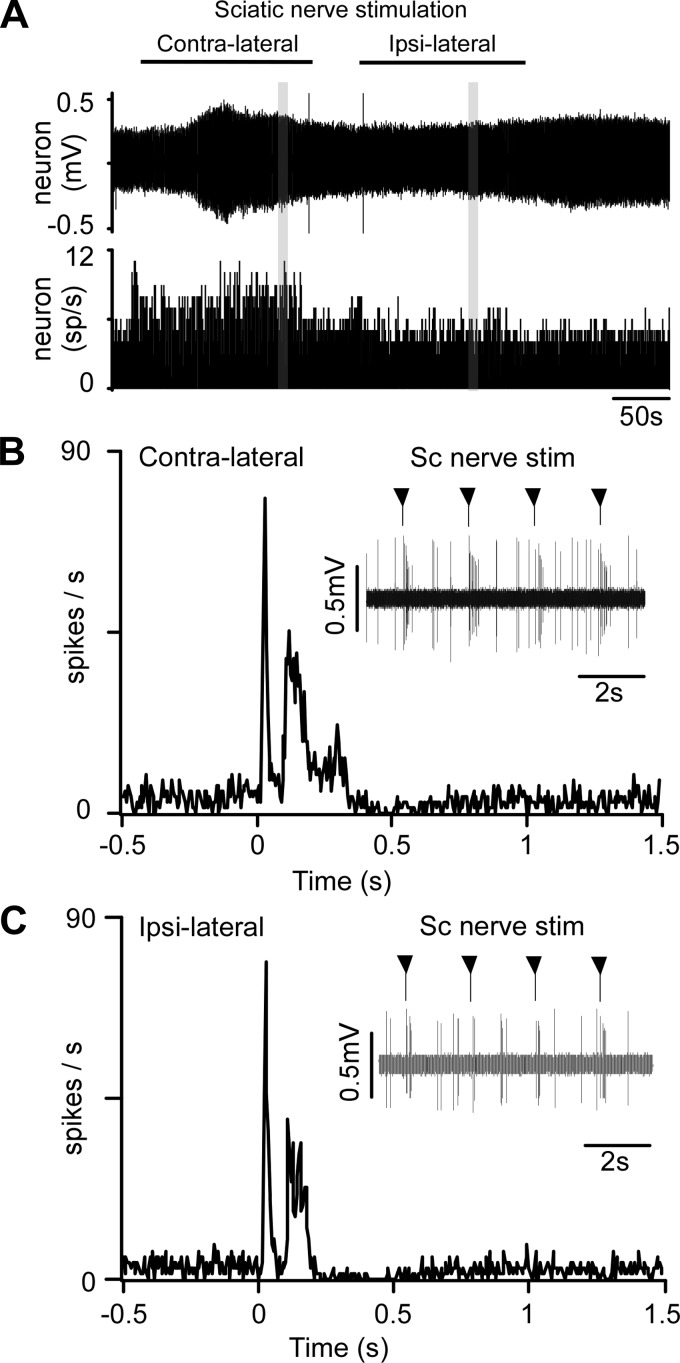
Fig. 7.
Activation of a presympathetic neuron by sciatic nerve stimulation. A, top: original trace of recorded single-unit (stimulation artifacts eliminated). Individual action potentials cannot be discriminated at this slow timescale. Bottom: integrated rate histogram showing the minimal effect of sciatic nerve stimulation on the mean discharge rate of the unit. B, top: expanded timescale excerpt of the unit's response to contralateral sciatic nerve stimulation (artifact suppressed, stimuli delivered at arrowheads). Bottom: poststimulus time histogram (stimuli delivered at time 0, artifacts eliminated) showing bimodal activation of neuron. C: response of the same unit to stimulation of the ipsilateral sciatic nerve (presentation as in B).

