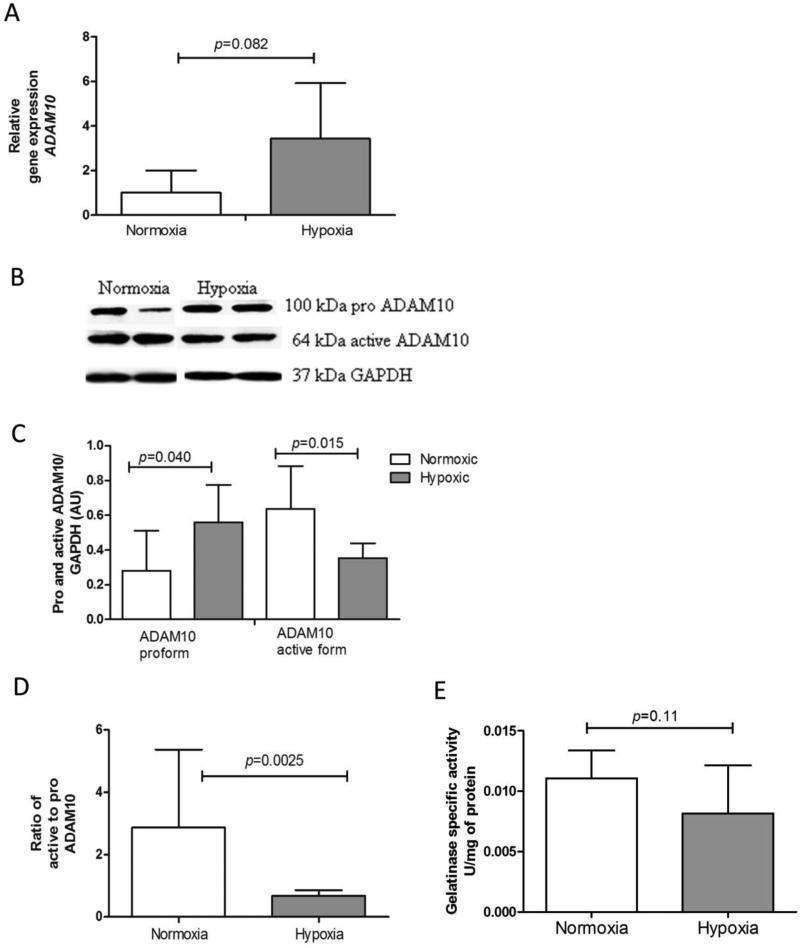
Fig 6.
Effects of chronic hypoxia on RAGE sheddase ADAM10 and gelatinase activity. A) Trend of increased ADAM10 gene expression in hypoxia exposed mice. Data are expressed as mean relative gene expression corrected for RPL13a ± SD; normoxia n=8, hypoxia n=7. B) Representative Western blots for pro ADAM10 and active ADAM10 on lung tissue lysates. C) Quantification of pro ADAM10 and active ADAM10 from Western blot, using GAPDH as an internal control. Data are expressed as mean arbitrary units ± SD; normoxia n=8, hypoxia n=5; the Mann-Whitney U test was used for statistical analyses. D) Ratio of active to pro ADAM10 from (C). E). Gelatinase activity was assessed in whole lung lysates and expressed as units/mg protein; normoxia n=8, hypoxia n=7; the Mann-Whitney U test was used for statistical analyses.

