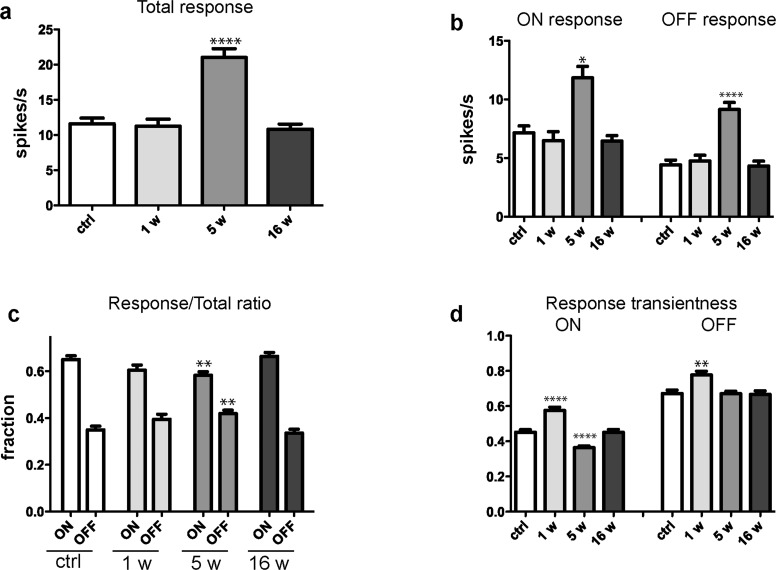
Figure 5.
Light-evoked responses change in a time-dependent manner after exposure to blast. (a) The total median response amplitude for RGCs in control (ctrl) retinas and at 1 (1w), 5 (5w), and 16 (16w) weeks after blast-exposure. (b) Average amplitude of response to maximal full-field stimulus of RGCs from control retinas and in retinas at 1 w, 5w, and 16w post blast. (c) The ON/Total ratio decreased significantly at 5w post blast, while the OFF/Total ratio increased significantly, and no significant difference is present at 1w and 16w post-blast exposure. (d) The transiency index of the response to the ON-set of light increased significantly at 1w and 5w post-blast, while the transiency index for the OFF-set of light increased 1w post blast. Statistical analysis performed by Mann-Whitney U test. Significant difference compared to controls; *P < 0.05, **P < 0.01, ****P < 0.0001.

