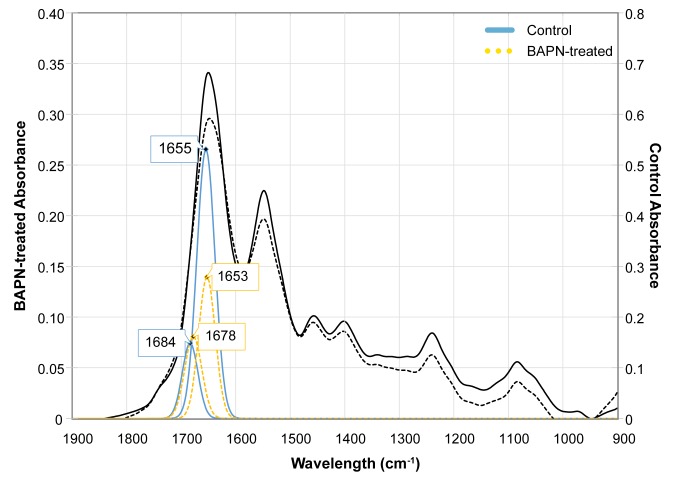
Fig 4. Representative mature and immature crosslink peak fittings underneath the FTIR spectral curve.
A decrease in the 1654cm-1 peak area is evident in the BAPN-treated sample relative to control. The BAPN-treated and control samples were plotted on different axes to visually highlight this difference. The black solid and dashed lines correspond to the full spectra of control and BAPN-treated samples, respectively.

