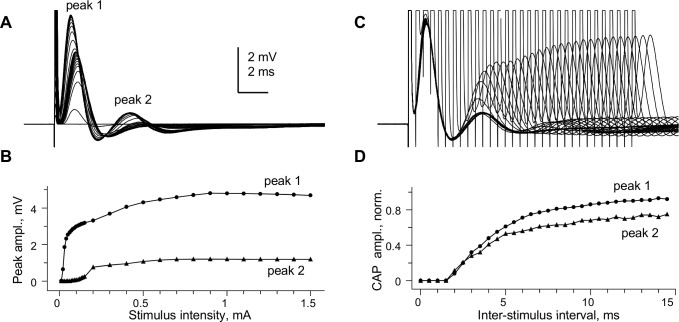
Fig 2. Stimulus-response relationship and refractoriness of “whole” CC compound action potential peaks.
This figure shows further details on “whole” CC CAP from in Fig 1C. (A) Superimposed CAPs recorded at varying stimulus intensities. (B) stimulus-response plot of amplitudes of peaks 1 and 2 for CAPs shown in (A). (C) Superimposed CAPs evoked by paired stimuli of varying intervals, with 0.5 ms interval increments. Individual traces in (B) and (C) are averaged from 6 consecutive recordings at each stimulation intensity, taken at 10 s intervals. (D) Plot of peak amplitudes of 2nd CAP in the pair as a function of inter-stimulus interval, normalized to peak amplitudes of the 1st CAP in the pair. The absolute refractory period of both peaks is 1.5 ms, while the relative refractory period of both peaks exceeded 15 ms. Conduction distance 1.5 mm; room temperature.

