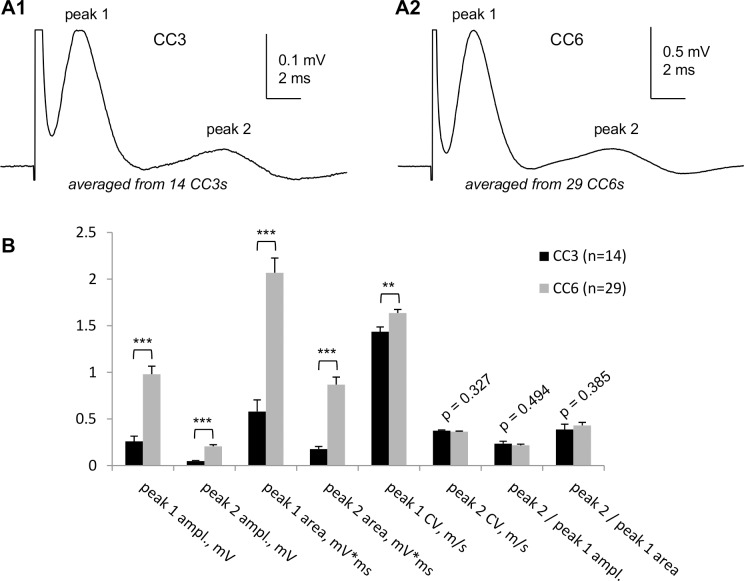
Fig 4. Detailed characteristics of “whole CC CAPs recorded at 4 mm conduction distance from CC3 and CC6.
(A1, A2) Digitally averaged “whole” CC CAPs recorded from 14 CC3s (A1) and 29 CC6s (A2) from different mouse brains. The CC3 and CC6 were identified as explained in Fig 3. Note different voltage scales in A1 and A2. (B) Detailed statistical comparison of “whole” CC3 and CC6 CAP parameters: ampl.—amplitude; CV—conduction velocity; peak2/peak1 ampl.—ratio of peak amplitudes; peak2/peak1 area—ratio of peak areas. ** p<0.01; *** p<0.001. All recordings were performed at room temperature.

