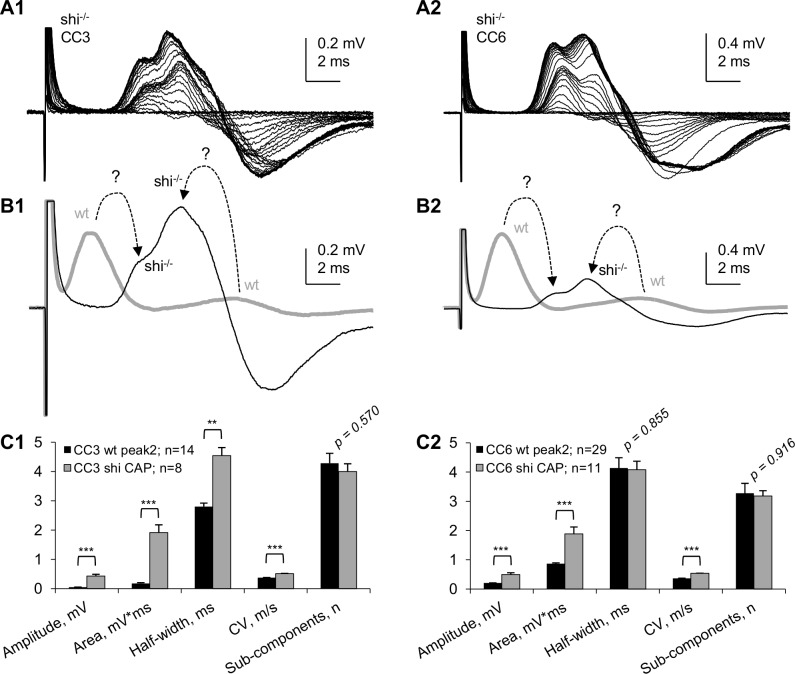
Fig 5. Comparison of “whole” CC CAPs of wild type (wt) and dysmyelinated shiverer (shi-/-) mice.
(A1, A2) Superimposed “whole” CC CAPs recorded at varying stimulation intensities in CC3 (A1) and CC6 (A2). Each trace in A1 and A2 represents an average of 6 consecutive recordings taken at 10 s intervals. (B1, B2) Digitally averaged “whole” CC CAPs recorded from wt (thick gray traces) and shi-/- (thin black traces) CC3 (B1, digitally averaged from 8 experiments) and CC6 (B2, digitally averaged from 11 experiments). CAPs from wt CCs, (digitally averaged, from Fig 4A1 and 4A2; brought to same scale with shi-/- CAPs) are shown in B1 and B2 as thick gray traces. Dashed arrows with question marks show hypothetical relationships between peaks of wt and shi-/- CAPs (see text). (C1, C2) Statistical comparison of main parameters of wt and shi-/- “whole” CC CAPs. ** p<0.01; *** p<0.001.

