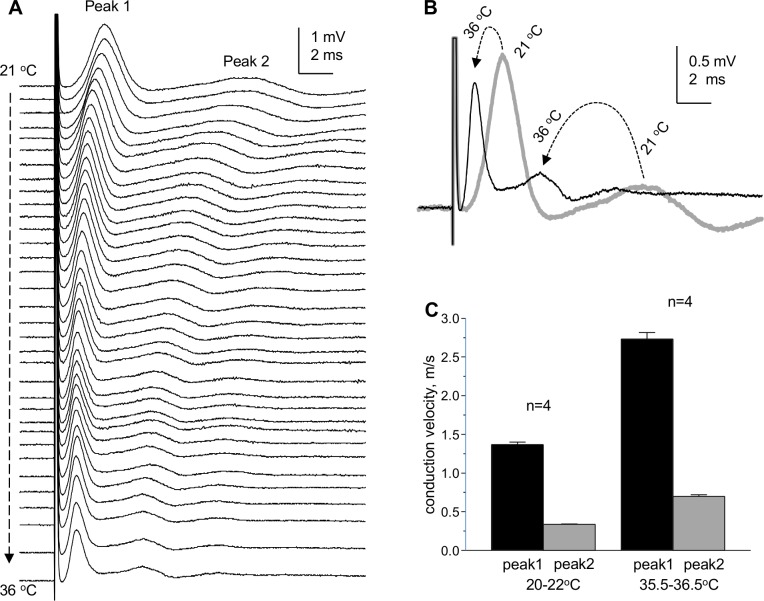
Fig 6. Temperature dependence of “whole” CC CAPs.
(A) Superimposed “whole” CC CAPs recorded during the increase of the temperature of perfusing solution from 21°C to 36°C. (B) Superimposed CAPs recorded at 21°C (thick gray trace) and 36°C (thin black trace). The dashed arrows show the changes of CAP peaks from room to high temperature. The CAPs shown in this figure were recorded without averaging to reflect the changes during the temperature test. From these experiments, we estimated the Q10 of conduction velocities of peak 1 (myelinated axons) and peak 2 (non-myelinated axons) as 1.33 and 1.37, respectively.

