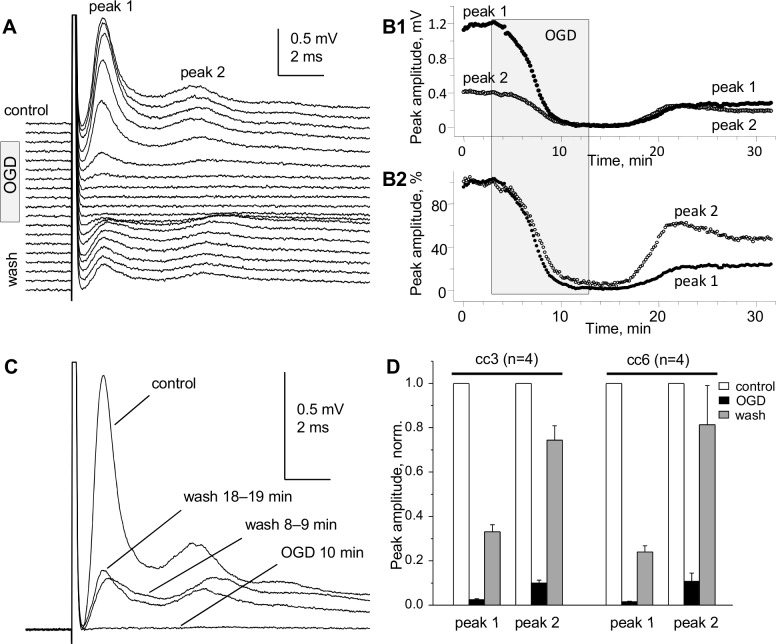
Fig 7. Pronounced effects of oxygen glucose deprivation (OGD) on “whole” CC CAPs.
(A) Superimposed CC CAPs recorded before (control), during OGD and during washout. (B1, B2) Time course of changes of absolute (B1) and normalized (B2) amplitudes of peaks 1 and 2 during 10-minute OGD and 20-minute washout. (C) Superimposed CAPs before, during and after OGD. (A-C) Representative data from a single experiment on CC6. The CAPs were recorded without averaging to reflect the fast changes during the test. (D) Summary of OGD–induced changes of CAP peaks after 10 min OGD and 20 min washout in CC3 and CC6. Temperature 35.5°C–36.5°C.

