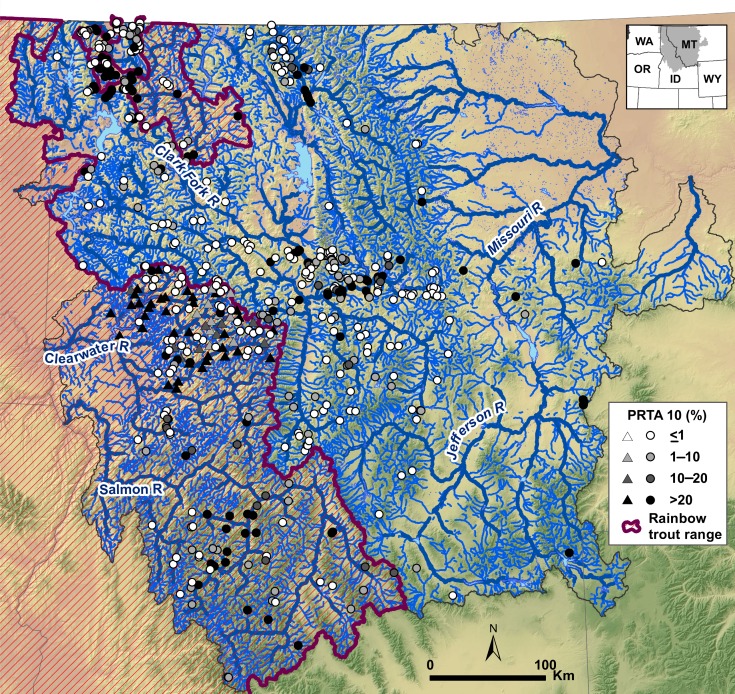
Fig 1. Sites in the synthetic analysis.
Study area showing elevation hillshade, stream network, overlap in the historical ranges of rainbow trout and westslope cutthroat trout (purple hashmarks overlaying the stream network), and locations of 558 sample sites, scaled by levels of introgression (<1%, white; 1–10%, light gray; 10–20%, dark gray; >20%, black), used to develop logistic regression models. Most sites (n = 501) provided estimates of the percentage of rainbow trout alleles at a site (PRTA; circles). Some sites (n = 57) provided only estimates of the percentage of fish with rainbow trout alleles (PFRT; triangles). Thick stream lines show rivers with mean annual flows that exceeded 2.83 m3/s.

