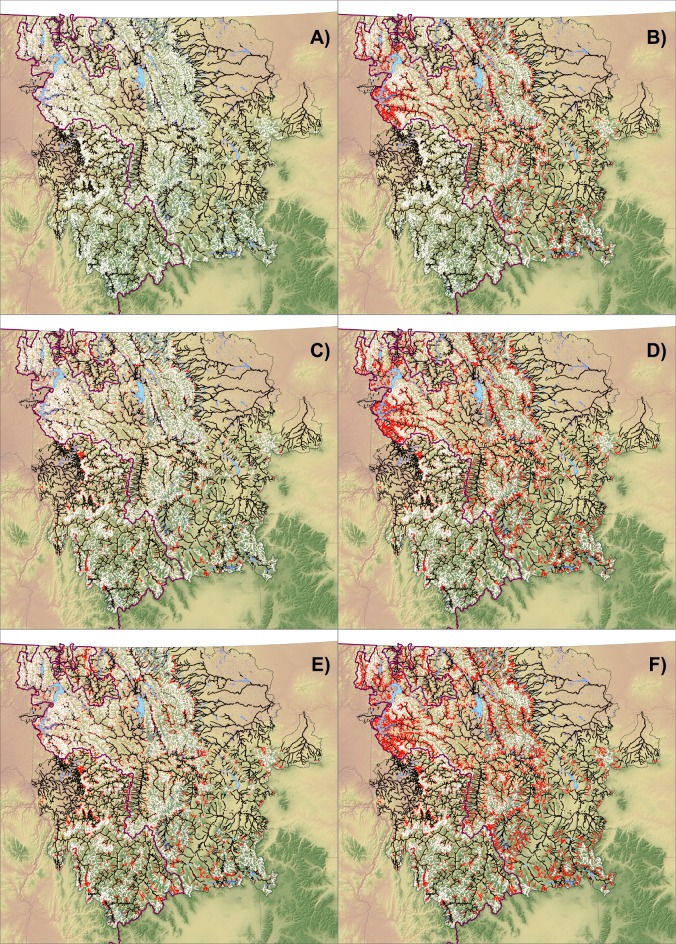
Fig 4. Predictions of 10% PRTA under multiple scenarios.
Prediction maps showing whether stream reaches are expected to remain below the classification threshold (0.384) for 10% rainbow trout alleles at a site (stream reaches in black, no; in white, yes). Panel A shows the current scenario and remaining panels show predictions relative to current conditions. Scenarios match those in Table 4 for current (panel A), equilibrium (panel B), current +0.5°C (panel C), equilibrium +0.5°C (panel D), current +1.0°C (panel E), and equilibrium +1.0°C (panel F). Reaches in red are those expected to exceed this threshold relative to the current scenario.

