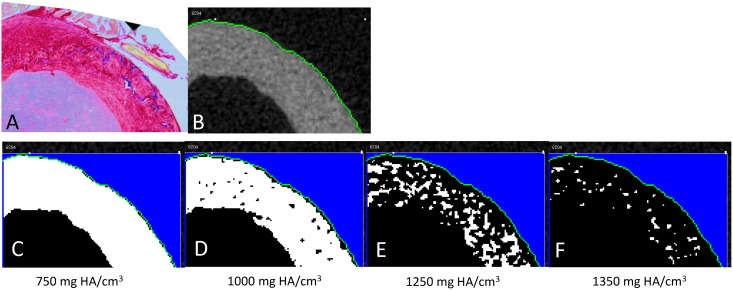
Fig 4. Example mouse femur histological cross section compared to high resolution microCT.
(A) Calcified cartilage, which is reportedly hyper mineralized compared to surrounding bone, is easily visible in histological sections stained with alcian blue and picrosirius red (blue tissue). (B-F) However, even with high-resolution cone-beam microCT (3.5um voxel), calcified cartilage cannot be distinguished from surrounding bone via mineral density thresholding. Thus, cone-beam microCT at 3.5um resolution cannot be used to quantify calcified cartilage.

