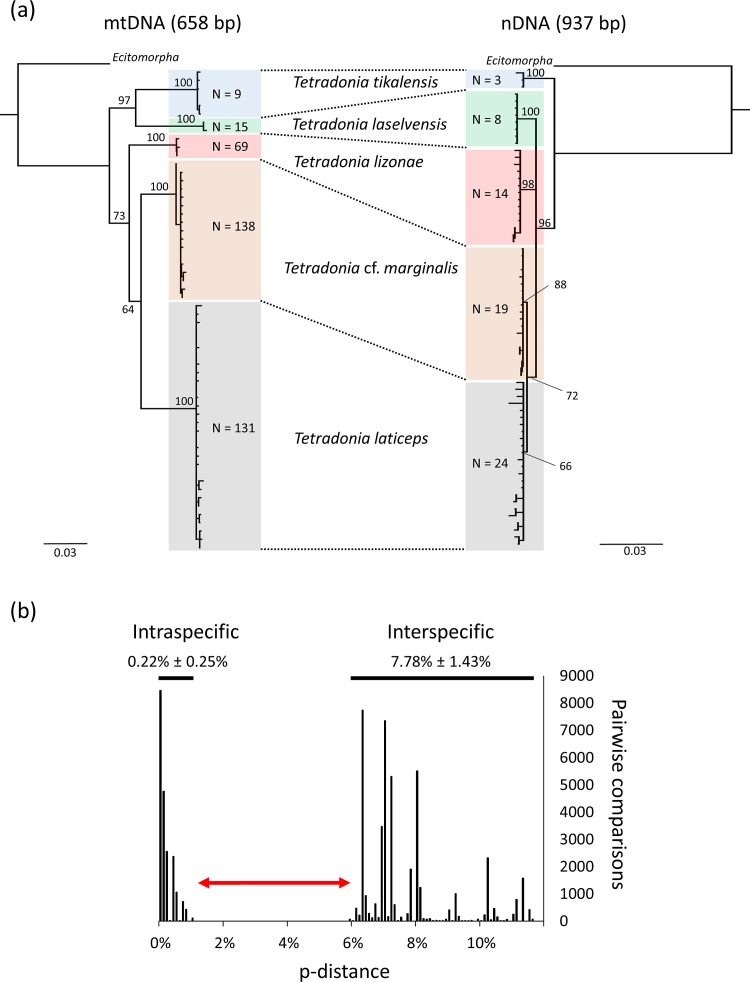
Fig 2. Genetic assessment of species boundaries in a community of Tetradonia beetles.
(a) NJ trees based on Tamura-Nei distances (scale bars) for both mitochondrial (COI sequences, left) and nuclear DNA sequences (concatenated wg and CAD sequences, right) reveal the same five genetic clusters (i.e. candidate species), which are depicted by separately colored boxes. Ecitomorpha arachnoides (Staphylinidae: Aleocharinae: Ecitocharini), collected in an emigration of Eciton burchellii foreli, served as outgroup. Numbers in boxes show the numbers of analyzed specimens. Bootstrap support values (1,000 replicates) for major nodes are shown. (b) Histogram showing intra- and inter-specific p-distances between Tetradonia mitochondrial COI sequences. P-distances give the proportion of bases that differ in pairwise-comparisons. A barcode gap (red double arrow) separates maximum distances within- from minimum distances between species. Mean ± SD p-distances within- and between groups are shown. Abbreviations: bp = base pairs, mtDNA = mitochondrial DNA, nDNA = nuclear DNA.

