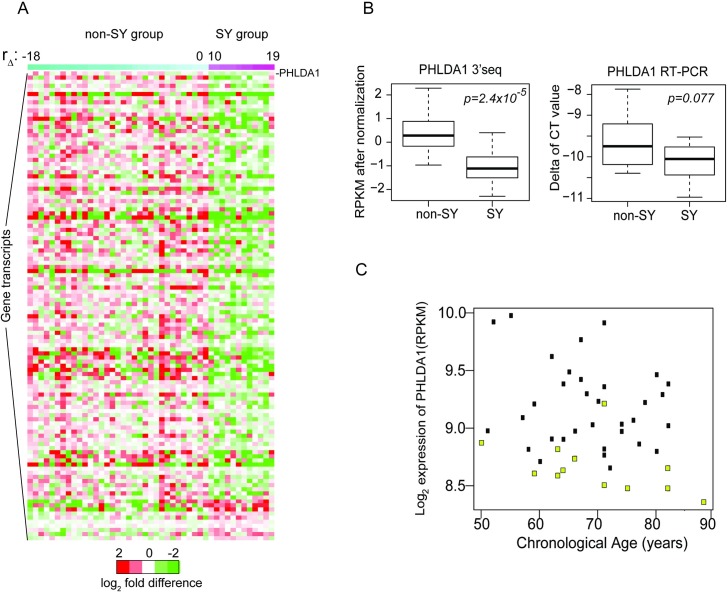
Fig 3. Gene expression profiles of SY (n = 12) versus non-SY individuals (n = 33).
(A) Heat map of gene expression profiles showing differences between SY and non-SY group, ranked by rdelta. Gene transcripts most significantly altered in SY are listed in descending order, with the most significant one being PHLDA1. S3A Table shows the full list of gene transcripts. (B) Differences in transcript levels of PHLDA1 between SY (n = 12) and non-SY (n = 33) groups by 3’seq and confirmed by RT-PCR. Expression levels by RPKM were normalized by batch and age effects as described in Methods section (left side of Fig 3B). For RT-PCR, the delta Ct values after normalization to internal control gene, actin-β are shown (right side of Fig 3B). (C) To examine levels of PHLDA1 in SY individuals over a range of ages, transcript levels were plotted versus chronological age (Fig 3C). SY individuals exhibited lower expression levels of PHLDA1 across multiple decades (yellow dot = SY individual, black dot = non-SY individual).

