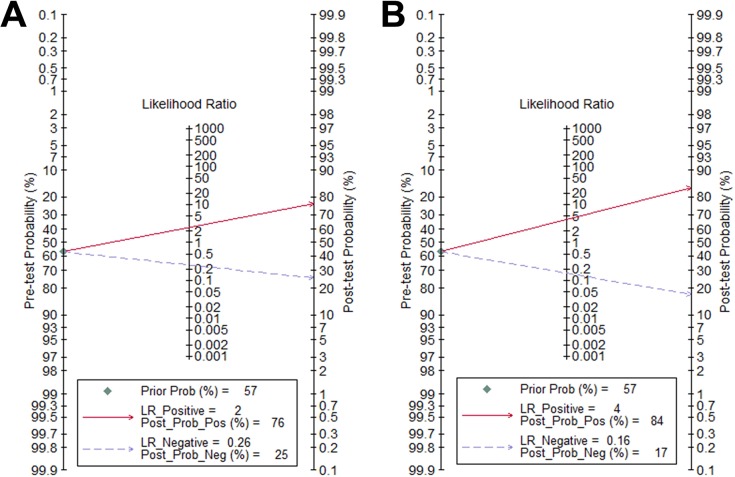
Fig 4. Fagan plot analysis to evaluating the clinical utility of liver and spleen stiffness for diagnosis of esophageal varices.
(A) For LS measurements, with a pre-test probability of EV of 57%, the post-test probability of EV, given negative and positive results, were 25% and 76%. (B) For SS measurements, with a pre-test probability of EV of 57%, the post-test probability of EV, given negative and positive results, were 17% and 84%.

