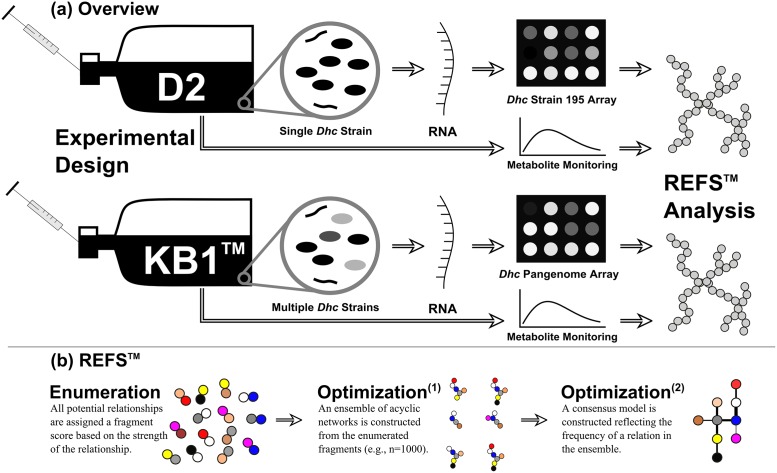
Fig 1. Diagram of the experimental and analytical procedures.
(a) Overview of the experimental design. The transcriptome of the continuously or batch fed D2 (single strain) or KB-1® cultures were monitored using microarrays, and the metabolite data was collected through chromatographic techniques. (b) Summary of the REFS™ gene network inference process. All possible edges are assigned a score based on the data in the enumeration step. Optimized networks and a consensus network are constructed from these enumerated fragments.

