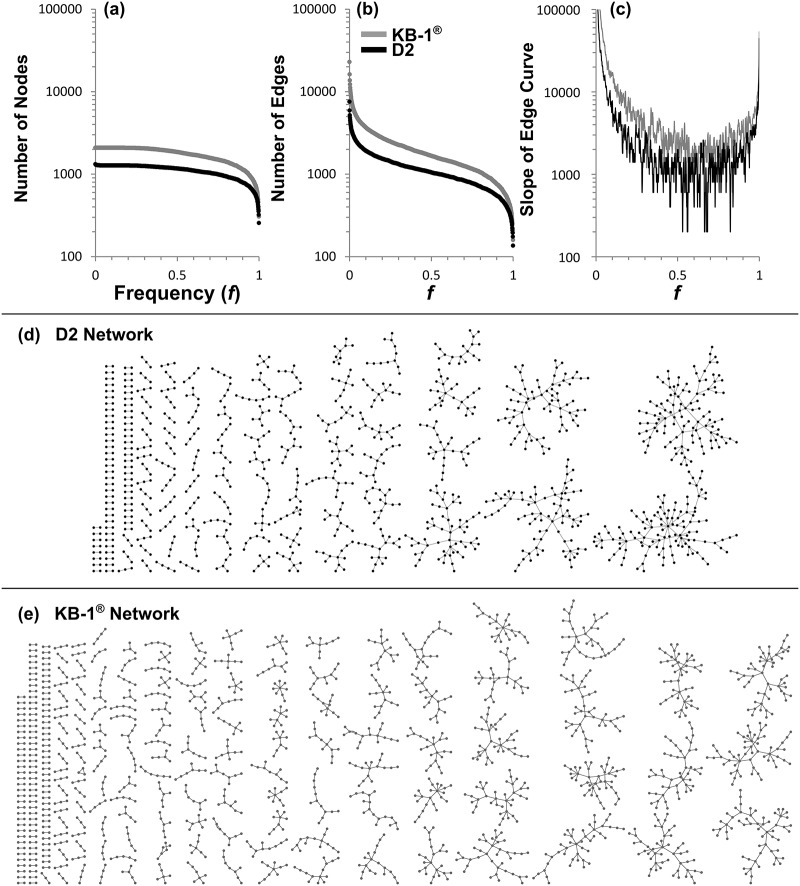
Fig 3. REFS™ network summaries for the D2 (black) and KB-1® (grey) networks.
The number of (a) nodes and (b) edges remaining in the network is plotted against the frequency cutoff established for the edges. (c) The slope of (b) versus frequency; the minimum was observed at approximately f = 0.6 for both networks. (d) The D2 consensus network of all edges with f ≥ 0.6. (e) The KB-1® consensus network of all edges with f ≥ 0.6. More detailed (e.g., with labels and edge strengths) consensus networks are available in S3 and S4 Files.

