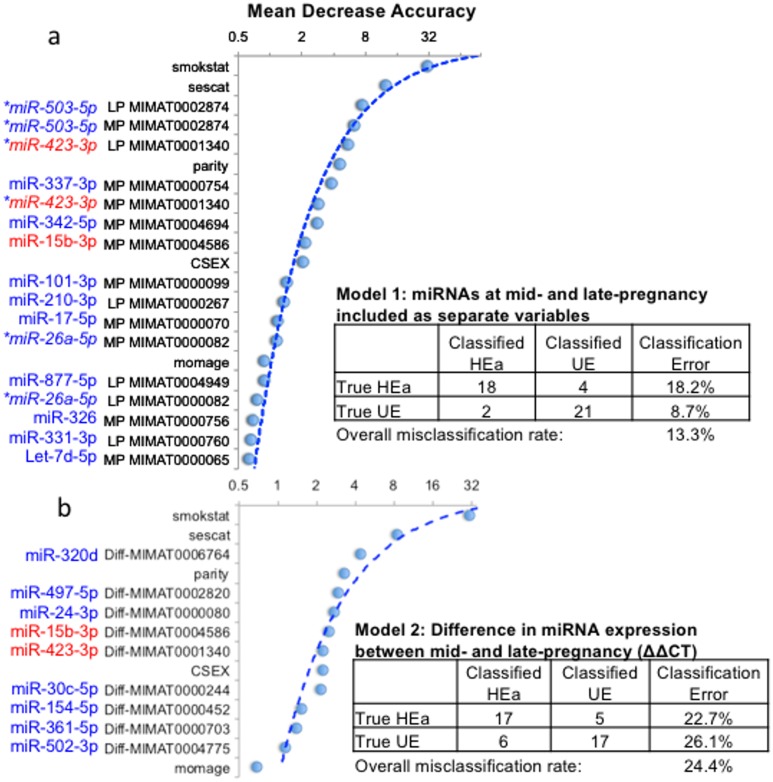
Fig 3. Random Forest Analysis (RFA) classifies HEa and UE maternal samples into distinct groups.
(a) RFA analysis comparing HEa and UE groups at mid (MP) and late (LP) pregnancy resulted in an overall classification error rate of 13% (18.2% for the HEa group and 8.7% for the UE group). miRNAs constituted 7 out of the top 10 variables that contributed to classification accuracy. Graph depicts Mean Decrease Accuracy (the effect of permuting a variable on prediction after training) on the X-axis and contributory variables in order of decreasing importance on the Y-axis. Astrisks indicate miRNA variables that contributed to prediction accuracy at mid- and late-pregnancy. (b) RFA analysis with difference in miRNA expression (ΔΔCT) between mid and late pregnancy. The overall misclassification rate increased to 24.4%. However, a plot of ‘Mean Decrease Accuracy’ (Y-axis) against variables (X-axis) showed that miRNAs constituted 6 out of the top 10 predictive variables. miRNAs in red text represent variables present in both model 1 and 2. For additional details, see S4 Fig. Smokstat, sescat, parity and momage are as defined in Table 1, CSEX is as defined in Table 2.

